ROAS vs POAS: which metric to use?
Written by
Maryna Semidubarska
Key takeaways
- Net revenue is the value of completed sales after discounts, returns, and refunds are deducted. Canceled orders and sales tax or VAT are excluded. Product and order costs are not deducted yet. In this article, revenue always means net revenue.
- In this article, profit means contribution profit: net revenue minus product and variable order costs, calculated before ad spend and fixed costs.
- Ad spend is the total amount you pay to run ads during a set period.
- Return on Ad Spend (ROAS) shows how well your ads generate revenue. It tells you how much revenue each $1 spent on ads produces. Product and order costs are not included.
- Profit on Ad Spend (POAS) shows if the sales generated by your ads are profitable. It tells you how much profit each $1 spent on ads produces. Product and order costs are deducted from revenue first.
- Stape's ROAS Calculator uses monthly ad spend and conversions to estimate current cost per acquisition (CPA), potential CPA, and potential monthly savings.
- When a setup misses purchases, a new, more complete tracking setup helps Google Ads and Meta Ads Manager record them. This increases the conversions they report and changes CPA and ROAS, even before actual sales change. Later changes in sales need a separate review of campaign optimization.
Two eCommerce campaigns can report the same ROAS but have very different POAS. Product cost, discounts, payment fees, shipping, and returns create that difference.
ROAS gives you a quick view of revenue from advertising. POAS adds the margin layer that eCommerce teams need for product and campaign decisions. This guide explains both formulas and shows how to use the ROAS Calculator by Stape to plan your next tracking step.
What is ROAS?
Return on Ad Spend (ROAS) shows how much revenue your ads produce for each dollar spent on them. The ROAS definition uses two numbers from the same period and within the same attribution scope.
ROAS = revenue attributed to ads / ad spend
You can report the result as a ratio or a percentage.
ROAS percentage = ROAS × 100
For example, an eCommerce store spends $10,000 on ads and attributes $50,000 in revenue to those ads.
$50,000 / $10,000 = 5.0 ROAS, or 500%This means that each $1 in ad spend produced $5 in recorded revenue.
ROAS helps you compare campaigns, channels, products, and periods. It is also used as a target for value-based bidding in platforms such as Google Ads.
The metric has an important limit. Revenue says nothing about the cost of the products sold. ROAS also leaves shipping, payment fees, discounts, returns, and other order costs outside the formula.
For a useful ROAS comparison, keep these inputs consistent:
- Use the same date range for revenue and ad spend.
- Use data from the same platform and count sales for the same number of days.
- Remove canceled and refunded orders.
- If your stores use different currencies, convert all amounts into one currency before comparing them.
What is POAS?
POAS stands for Profit on Ad Spend. You may also see the phrase Profit Over Ad Spend. Both names describe the same marketing metric.
POAS shows how much profit your ads produce for each $1 spent on advertising.
To calculate POAS, start with revenue from sales linked to your ads. Remove discounts, canceled orders, returns, taxes, product costs, and order costs. Do not remove ad spend yet. Divide the amount left by ad spend.
POAS = contribution profit before ad spend / ad spend
POAS percentage = POAS × 100
For example, a campaign produces $50,000 in revenue. Product and order costs total $35,000, so $15,000 remains. Ad spend is $10,000.
$15,000 / $10,000 = 1.5 POAS, or 150%This means each $1 spent on ads produced $1.50 after product and order costs. After the $1 ad cost is covered, $0.50 remains.
A POAS of 1.0 is the advertising break-even point. At 1.0, the contribution profit covers the ads, with nothing left for fixed costs or final profit. Your business target, therefore, needs to sit above 1.0, with the exact level based on your fixed costs and profit goal.
What is the difference between POAS and ROAS?
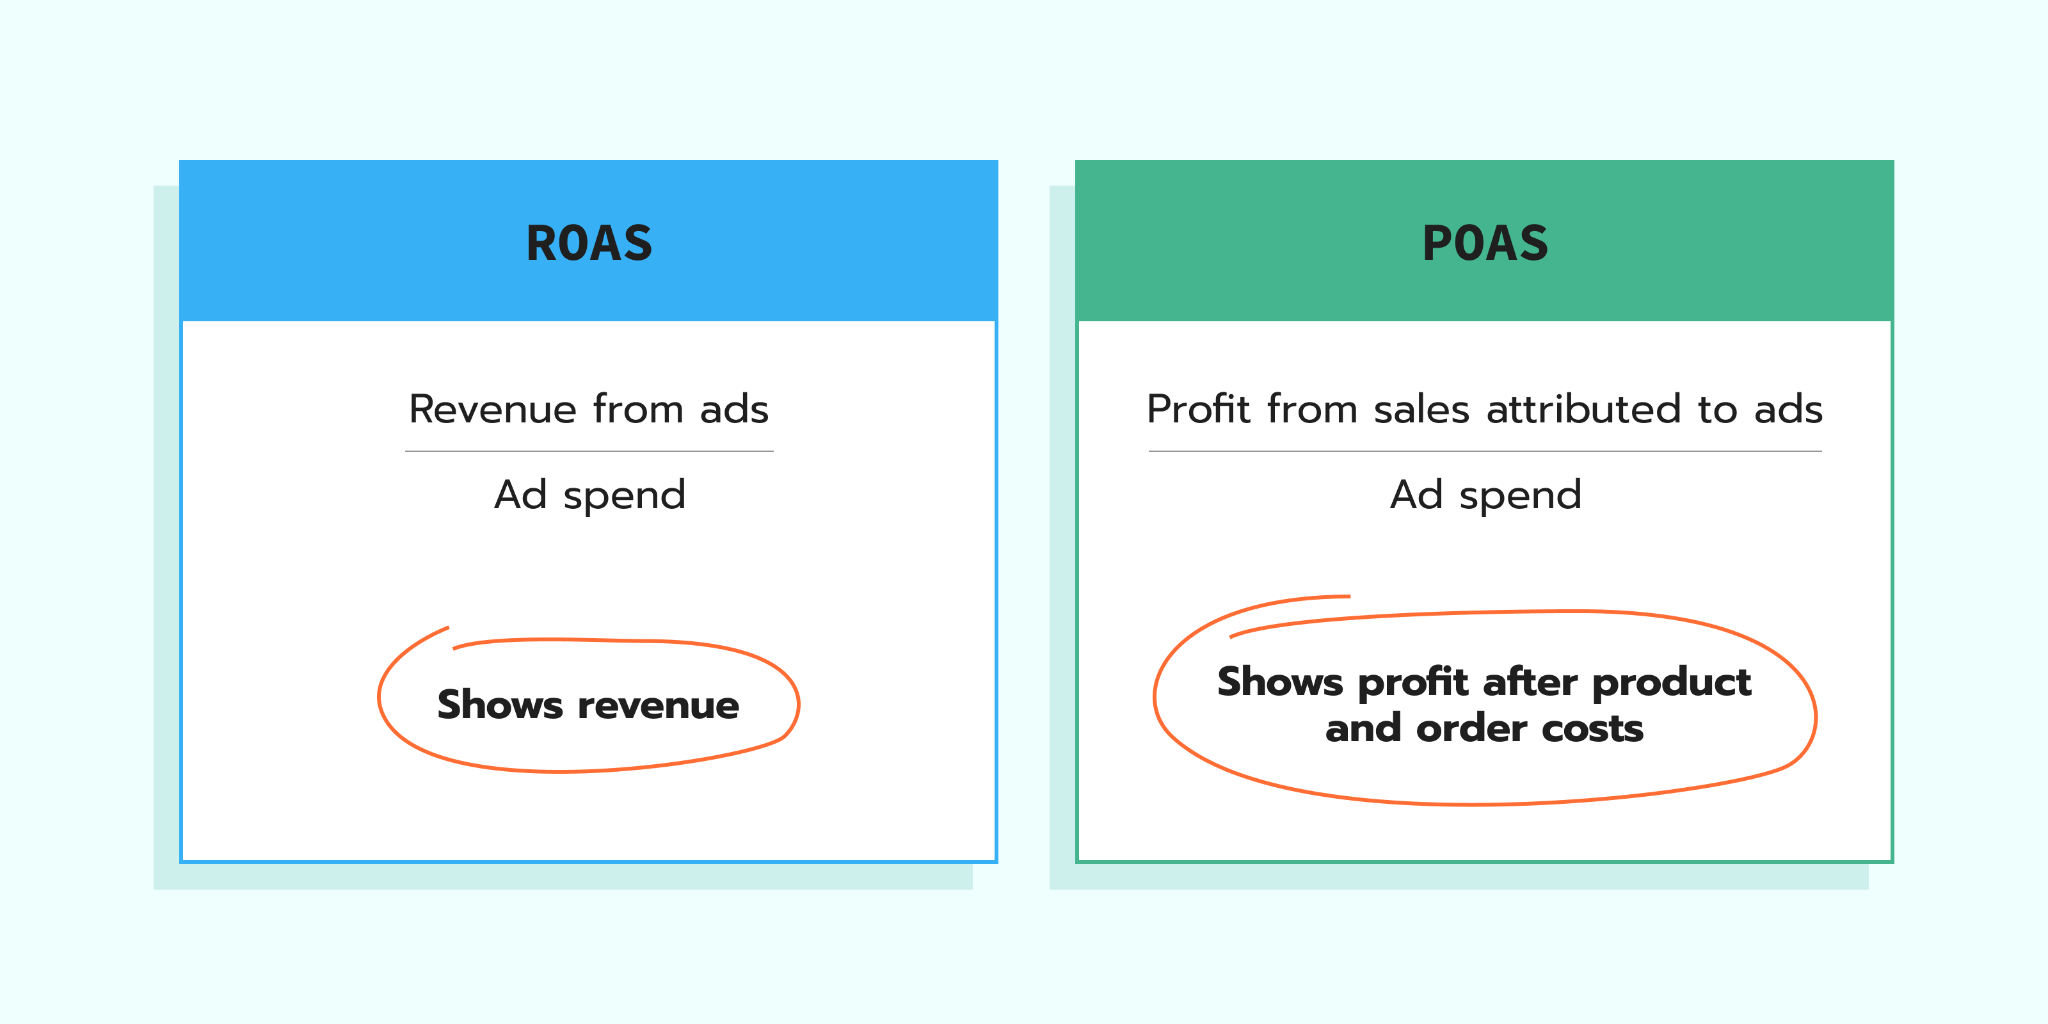
ROAS and POAS use the same denominator, ad spend. The numerator changes from revenue to contribution profit.
| Question | ROAS | POAS |
|---|---|---|
| Full meaning | Return on Ad Spend | Profit on Ad Spend |
| Numerator | Revenue attributed to ads | Profit from sales attributed to ads |
| Denominator | Ad spend | Ad spend |
| Main use | Measure how much revenue your ads generate | Measure how much profit your ads generate after product and order costs |
| Costs included | Ad spend only | Ad spend and costs linked to the sales generated by ads |
| Main risk | A high ROAS can still mean low profit | Missing or outdated costs give you the wrong result |
| Useful for | Revenue planning, channel comparison, and bidding based on order value | Decisions at product level, budgeting based on margin, and bidding based on profit value |
The ROAS vs POAS difference matters most when your products have varied margins. A campaign that sells expensive, low-margin products can show strong ROAS and weak POAS. Another campaign can bring less revenue and leave more profit.
POAS also needs a clear internal definition of profit. One team can subtract only the cost of goods sold. Another can include payment fees, and expected returns. Choose one calculation with your finance team and use it across every campaign and period.
ROAS and POAS eCommerce examples
Let's study two campaigns with the same $10,000 ad spend.
| Metric | Campaign A | Campaign B |
|---|---|---|
| Ad spend | $10,000 | $10,000 |
| Revenue attributed to ads | $50,000 | $40,000 |
| Product and variable order costs | $35,000 | $20,000 |
| Profit before ad spend | $15,000 | $20,000 |
| ROAS | 5.0 or 500% | 4.0 or 400% |
| POAS | 1.5 or 150% | 2.0 or 200% |
| Profit after ad spend | $5,000 | $10,000 |
Campaign A generates more net revenue for the same ad spend, so it has the higher ROAS. However, product and order costs take a larger share of its revenue. Campaign B has the higher POAS because more remains after these costs for each $1 spent on ads.
After ad spend is deducted, Campaign A leaves $5,000 and Campaign B leaves $10,000. Fixed business costs still need to be paid from these amounts.
Use this comparison before deciding where to spend more. Check actual ad spend to see how much budget each product or campaign receives. Then check ROAS and POAS together: a campaign that brings in more revenue per ad dollar does not always leave more profit after costs.
How does ROAS Calculator by Stape work?
The free ROAS Calculator by Stape helps you plan the possible impact of server-side tracking. It asks for ad spend and conversions, then returns a CPA and a savings scenario in seconds.
What should you enter in the calculator?
Use numbers from the same month and the same advertising scope.
1. Enter the total of your online advertising budget per month.
2. Enter the number of conversions from online advertising that you get per month.
3. Read your current average CPA.
4. Review your potential average CPA with server-side tracking.
5. Check potential savings with server-side tracking.
For eCommerce, use purchase conversions if you want the output to represent cost per purchase. If you mix purchases, add-to-cart events, and leads, the average CPA will not support a clean ROAS or POAS calculation.
What does the calculator estimate?
The ROAS Calculator gives the following metrics:
- Current CPA
- Potential CPA after switch to server-side tracking
- Potential savings after the switch
The potential CPA is a modeled estimate, not a forecast or guaranteed result. The calculator does not know your margins, average order value, attribution settings, traffic quality, or actual implementation quality.
The savings result estimates how much less ad spend you would need to produce your current conversion count at the modeled lower CPA.
This is a planning scenario. Tracking setup, consent rates, browser mix, traffic quality, average order value, product margin, and campaign changes influence the results you record after implementation.
A worked calculator example
For example, you have a monthly ad budget of $10,000 and 300 conversions (completed purchases). The calculator returns these results:
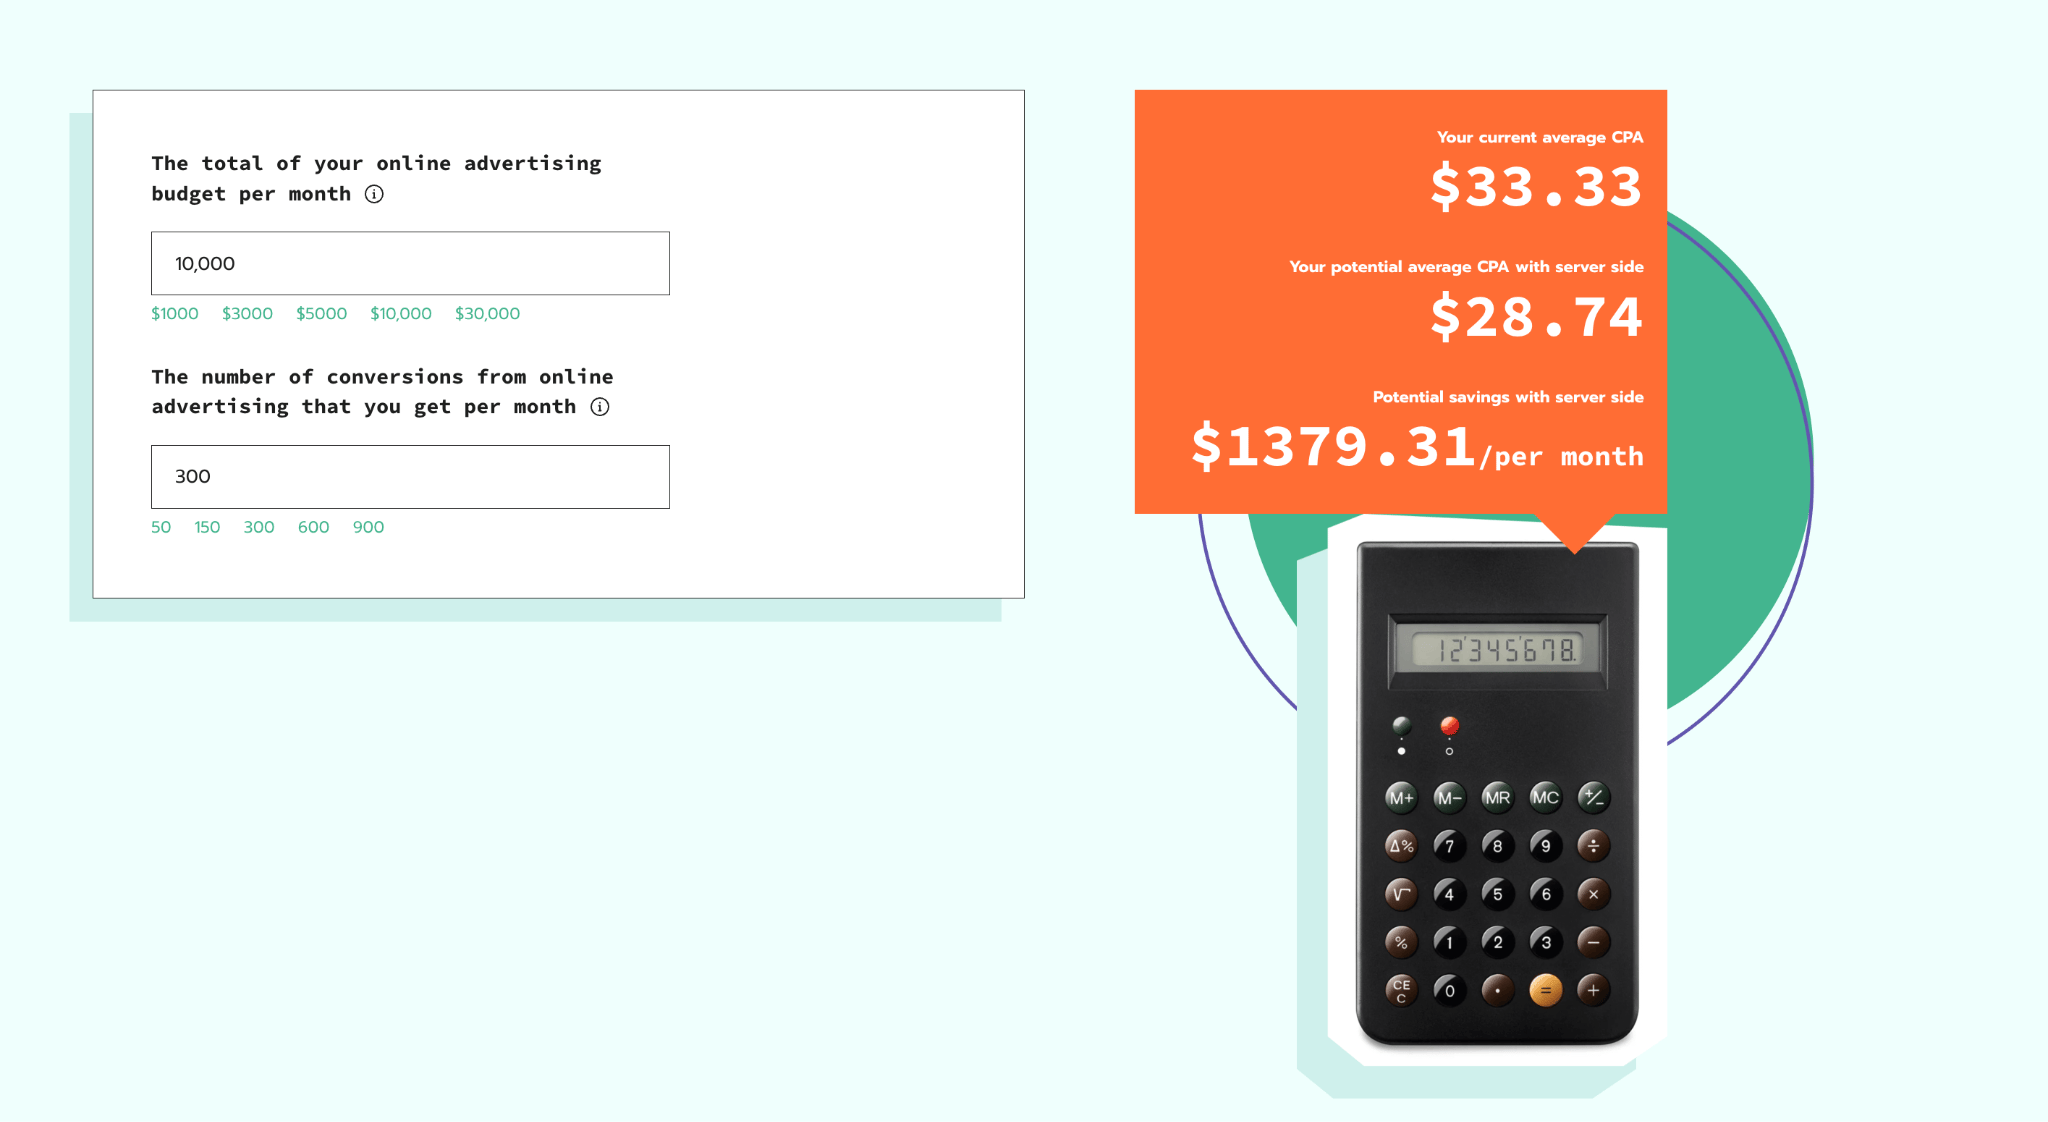
The potential savings compare the current $10,000 spend with the cost of 300 conversions at a $28.74 CPA after switching to server-side tracking. This is why the output shows about $1,379 per month.
How do you connect the result to ROAS and POAS?
In addition to the number of conversions and a CPA, you need two more numbers to estimate ROAS and POAS:
- Average order value: the average revenue from one order.
- Average profit per order: the average amount from one order after product and order costs.
Use these formulas:
ROAS = average order value / CPA
POAS = average profit per order / CPA
In the example from the previous section, the CPA is $33.33 (Ad spend / conversions), and the potential CPA shown by the calculator is $28.74.
Suppose customers spend $100 per order on average:
Current ROAS = $100 / $33.33 = 3.0


Potential ROAS = $100 / $28.74 = 3.48
This means each $1 spent on ads generates $3 in revenue with the current CPA and an estimated $3.48 with the potential CPA.
Now suppose $40 remains from each $100 order after product and order costs:
Current POAS = $40 / $33.33 = 1.20


Potential POAS = $40 / $28.74 = 1.39
This means each $1 spent on ads generates $1.20 after product and order costs with the current CPA and an estimated $1.39 with the potential CPA.
How should you use the CPA estimate?
Treat the "CPA after switching to server-side tracking" as a starting estimate. To see what changed after the setup, compare the same numbers from before and after the switch.
1. Save your current results. Choose one full period, such as one month. Record your ad spend, purchases, revenue, profit, CPA, ROAS, and POAS.
2. Collect new results after the switch. Use a period of the same length and collect the same data. Do not change your budget, ads, or campaign settings during the comparison.
Before changing your Google Ads Target ROAS, collect at least four weeks of data. If customers take longer to buy after clicking an ad, wait until those purchases are counted as well.
3. Compare the results. Take CPA and ROAS from your ad platform. Calculate POAS yourself unless your tracking setup already sends profit data to the platform. Compare the before-and-after numbers.
Check whether the new setup records completed purchases that tracking previously missed. Confirm that these purchases are valid and counted once. Recovering missing purchase data gives the ad platform more information to guide its bids, even when your total sales stay the same.
Then compare completed purchases, net revenue, and profit in your business’s sales and accounting records before and after the switch. These figures show whether business results changed. Also check ad spend, discounts, and other changes: a rise in sales alone does not prove that server-side tracking caused it.
What do Stape case studies show about ROAS and CPA?
ROAS Calculator by Stape uses a planning scenario, while case studies show a range of recorded outcomes.
- ApriL Parfumerie moved its GA4 and Meta tracking to a server-side setup on Stape. More complete tracking and less data loss helped Meta record 40–50% more conversions.
- A Danish eyewear store had many visits incorrectly reported as Direct in GA4. After Stape Care set up server-side tracking, Direct traffic fell by 67.9%, and GA4 recorded 37.5% more reported revenue.
- A skincare brand was missing purchases and recording some events twice. Server-side tracking fixed these problems, and the brand recorded a 39% lower Google Ads cost per purchase.
- Nail polish brand Herzlack’s tracking missed an estimated 20% of sales. Agency ZweiDigital rebuilt its Meta tracking using Stape. After the change, Herzlack reported 37% higher ROAS and 20% lower CPA.
These are individual company results. They support the value of testing the calculator scenario against your own data, rather than using one percentage as a universal benchmark.
How can you use ROAS and POAS together?
ROAS and POAS answer different questions. ROAS shows how much revenue your ads generate. POAS shows whether enough remains to cover ad spend after product and order costs are paid.
Check both before you decide where to spend more.
1. Use matching results
Check ROAS and POAS for the same campaign, products, and dates. For example, do not compare ROAS for one month with POAS for one week.
2. Compare each result with its own target
Do not compare ROAS directly with POAS. Compare ROAS with your ROAS target. Then compare POAS with your POAS target.
A target is the minimum result you want the campaign to reach. Targets differ because companies and products have different costs.
If you do not have a ROAS target yet, start with your advertising break-even ROAS. This is the lowest ROAS that covers product, order, and ad costs.
Suppose you have:
- $100 in revenue
- $60 in product and order costs
- $40 left before paying for ads
The $40 is 40% of your revenue. This percentage is your contribution margin rate:
Contribution margin rate = ($100 − $60) / $100 = 0.40, or 40%Now calculate your advertising break-even ROAS:
Break-even ROAS = 1 / contribution margin rate
1 / 0.40 = 2.5, or 250% ROASWhy is 250% the break-even point? After product and order costs, only $40 remains from the $100 revenue. The business can spend a maximum of $40 on ads before it starts losing money:
If the business spends the full $40 on ads, nothing remains for fixed business costs or final profit. Its ROAS target therefore needs to be higher than 250%.
For POAS, 100% is the advertising break-even point. It means that the amount left after product and order costs only covers ad spend. Your POAS target needs to be higher than 100% to cover fixed costs and leave final profit.
3. Read the two results together
| ROAS result | POAS result | What it means and what to check |
|---|---|---|
| Meets target | Meets target | Both targets are met. Check stock and cash flow before increasing ad spend so you are sure you can satisfy the new potential demand and also cover the ad spend. |
| Meets target | Below target | Ads generate enough revenue, but too little remains after costs. Review product costs, discounts, returns, shipping, and payment fees. |
| Below target | Meets target | Sales leave enough after costs, but ads do not generate enough revenue. Update your ads so profitable products can reach more buyers. |
| Below target | Below target | Both targets are missed. Place a test order and use your tracking tool's preview mode to confirm that the purchase is recorded without duplication with the correct transaction ID, revenue, and currency. If the data is correct, review your ads, audience, offer, and costs. |
ROAS tells you whether your ads generate enough revenue. POAS tells you whether those sales leave enough after costs. One result can meet its target while the other misses it, so always check both.
How can Stape help you track ROAS and POAS?
Stape helps you collect the purchase data used for both metrics. Server GTM hosting by Stape runs the server GTM container used to send purchase events to your analytics and ad platforms. Custom Loader helps you capture more complete data, saving it from ad blockers. Stape Analytics shows how many requests were recovered. This all gives you more complete revenue data for ROAS.
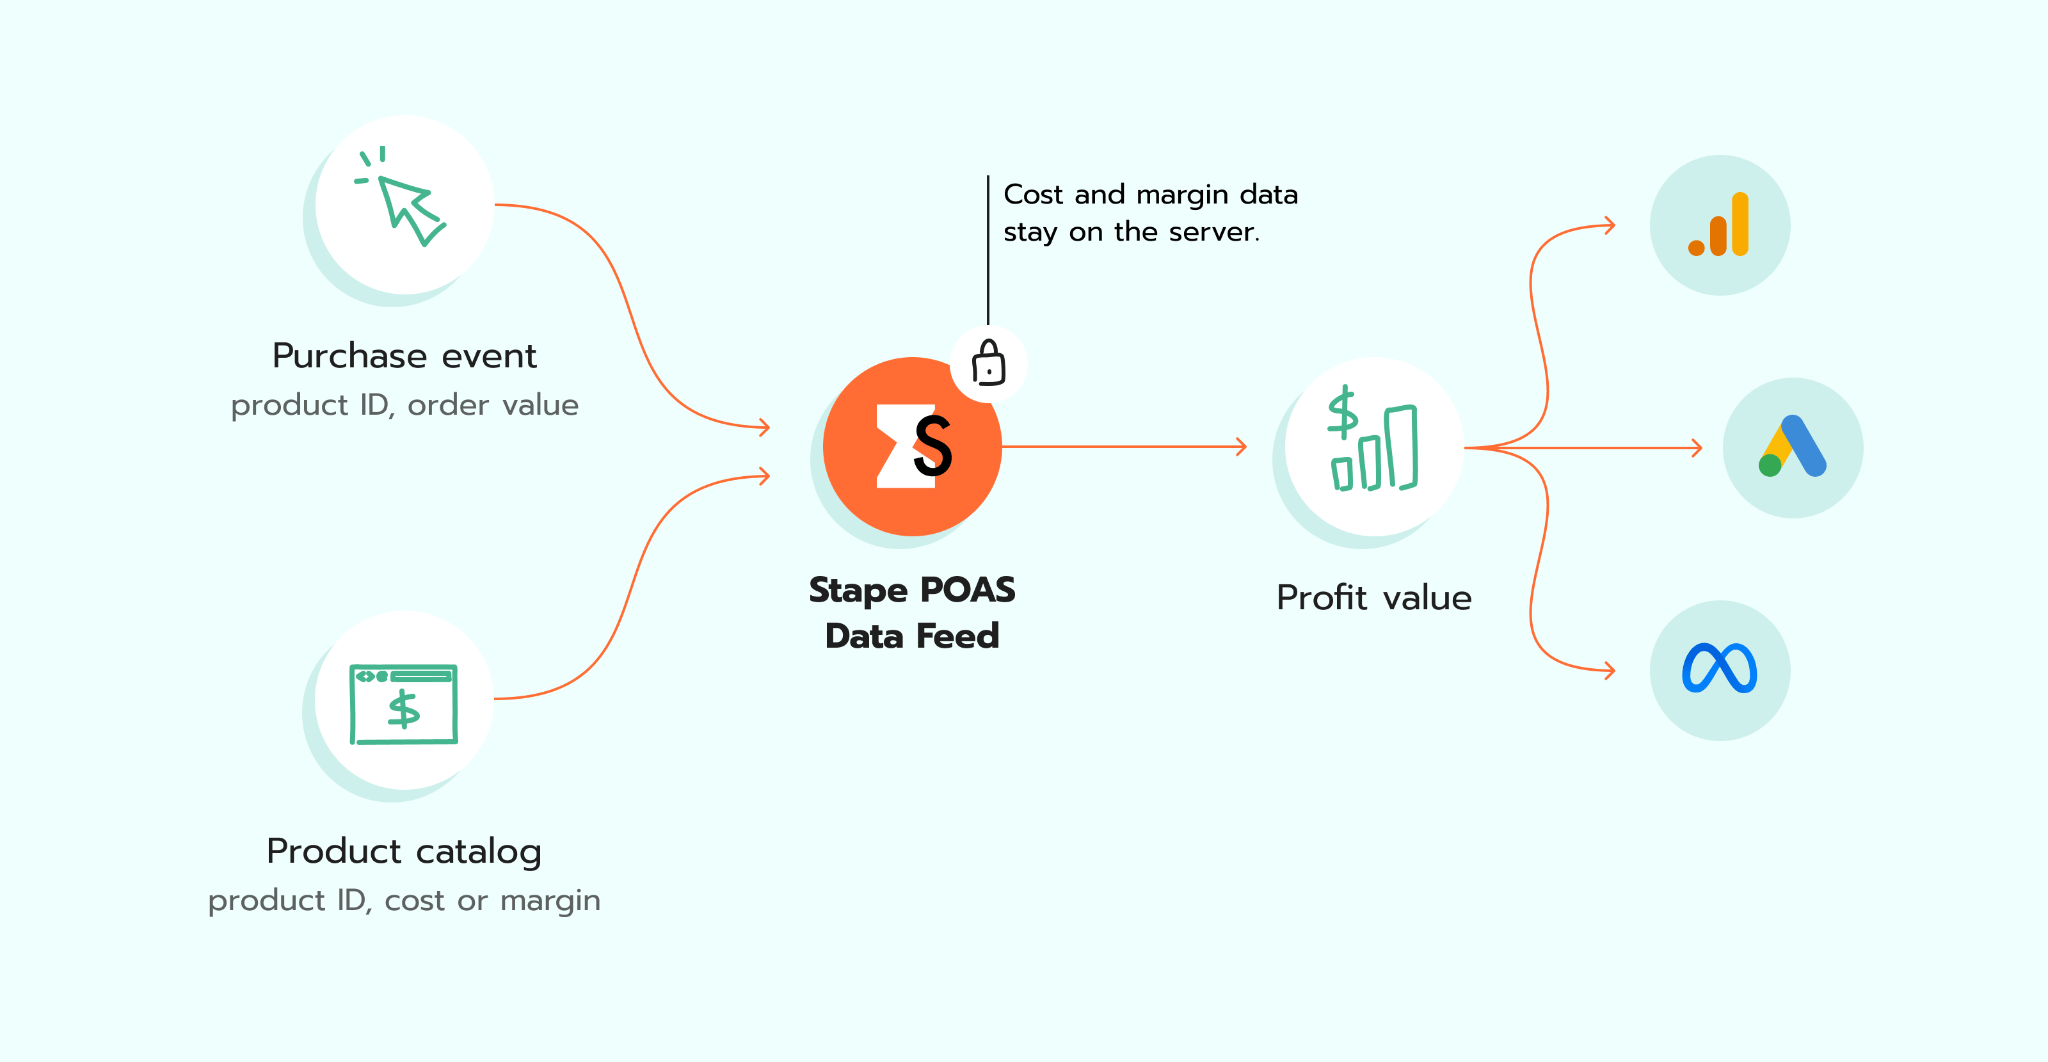
POAS Data Feed by Stape helps you track profit. Add the cost or profit margin for each product, and when someone buys a product, the power-up calculates the profit from the order and sends it to your analytics or ad platform. You can then use revenue for ROAS and profit for POAS.
Not sure how good your tracking setup is? Scan your site with Website Tracking Checker by Stape. The free tool finds common issues in web and server-side tracking and gives you steps to fix them.
What common ROAS and POAS mistakes should you avoid?
Comparing different periods
Revenue, profit, and ad spend must cover the same dates. Include the full conversion delay before you judge the latest period, as some high-margin products have long sales cycles.
Using gross order value as revenue
Canceled orders, refunds, discounts, and sales tax can make reported revenue larger than the amount the business keeps. Use a documented net revenue value.
Subtracting ad spend twice in POAS
Use contribution profit before ad spend in the numerator. Place ad spend in the denominator. If you subtract it from both places, POAS becomes too low and is harder to compare.
Mixing profit definitions
Keep one profit definition across products, campaigns, and periods. Document each included cost and update product values when costs change.
Treating recovered conversions as new sales
An ad platform can report more conversions after tracking improves because it now sees purchases that were missed before. Compare completed orders and revenue in your online store before and after the tracking update. If the store numbers stayed the same, the change shows improved tracking rather than sales growth.
Changing to profit-based bidding without a plan
Ad platforms usually receive the full order revenue. They use this value to report ROAS and guide automated bidding. To make bidding focus on profit, the platform also needs a profit value. Keep the revenue conversion for ROAS and create a separate profit conversion for POAS. Test the profit conversion, then choose only one of them to guide bidding, so the same purchase does not influence bidding twice.
In Google Ads, the profit conversion can stay Secondary while you test it. Secondary conversions are normally used for reporting, while Primary conversions guide bidding.
FAQs
Want to start on the server side?
Try for freeRecommended for you
Blog
Essential eCommerce KPIs to measure and maximize performance
Learn how eCommerce KPIs help improve every stage of your eCommerce funnel. Track key metrics to boost performance and drive more conversions.
Sep 16, 2026

Comments