How to prove server-side tracking ROI to clients and stakeholders
Maryna Semidubarska
AuthorKey takeaways:
You pitched server-side tracking, got an approval, and launched the setup. Now it's time to move to the part that builds long-term trust: proving the setup is working and showing what changed after launch. Clients and stakeholders expect clear evidence, so your report needs to show healthier measurement, stronger attribution signals, and a clear path to business impact. This guide shows you exactly how to validate the impact of server-side tracking.
In stakeholder reports and decks, separate two things every time:
- Measurement lift: more events recorded, fewer gaps, better attribution signals.
- Business lift: more revenue or profit.
Remember: part of the lift you see after launch can come from recovered attribution signals, not from a real business change. So it is important to set a test group and a control group to check if revenue or profit also changed.
Why proving impact isn't always straightforward
After server-side tracking goes live, GA4 and ad platform reports can go up even when your marketing activity stays the same. This is called a measurement lift. More events reach these platforms, attribution gets stronger, and optimization signals become more complete.
Business lift is a separate step. You prove it by comparing results under similar conditions or by running paid campaign tests with a stable setup. Then you check outcomes like revenue, qualified leads, CPA, or ROAS.
Each business will see different measurement lift numbers. The result depends on traffic sources, browser mix, ad blocker usage, and how much data was missing before setup. Server-side tracking improves data delivery and control, while final business results still depend on your offer, landing page speed, audience fit, and ad creative.
What server-side tracking improves
Server-side tracking usually adds a middleware layer: events still happen in the browser, but requests go through a cloud server (often on a first-party subdomain like anything.yoursite.com), where you can route, enrich, filter, and forward them.
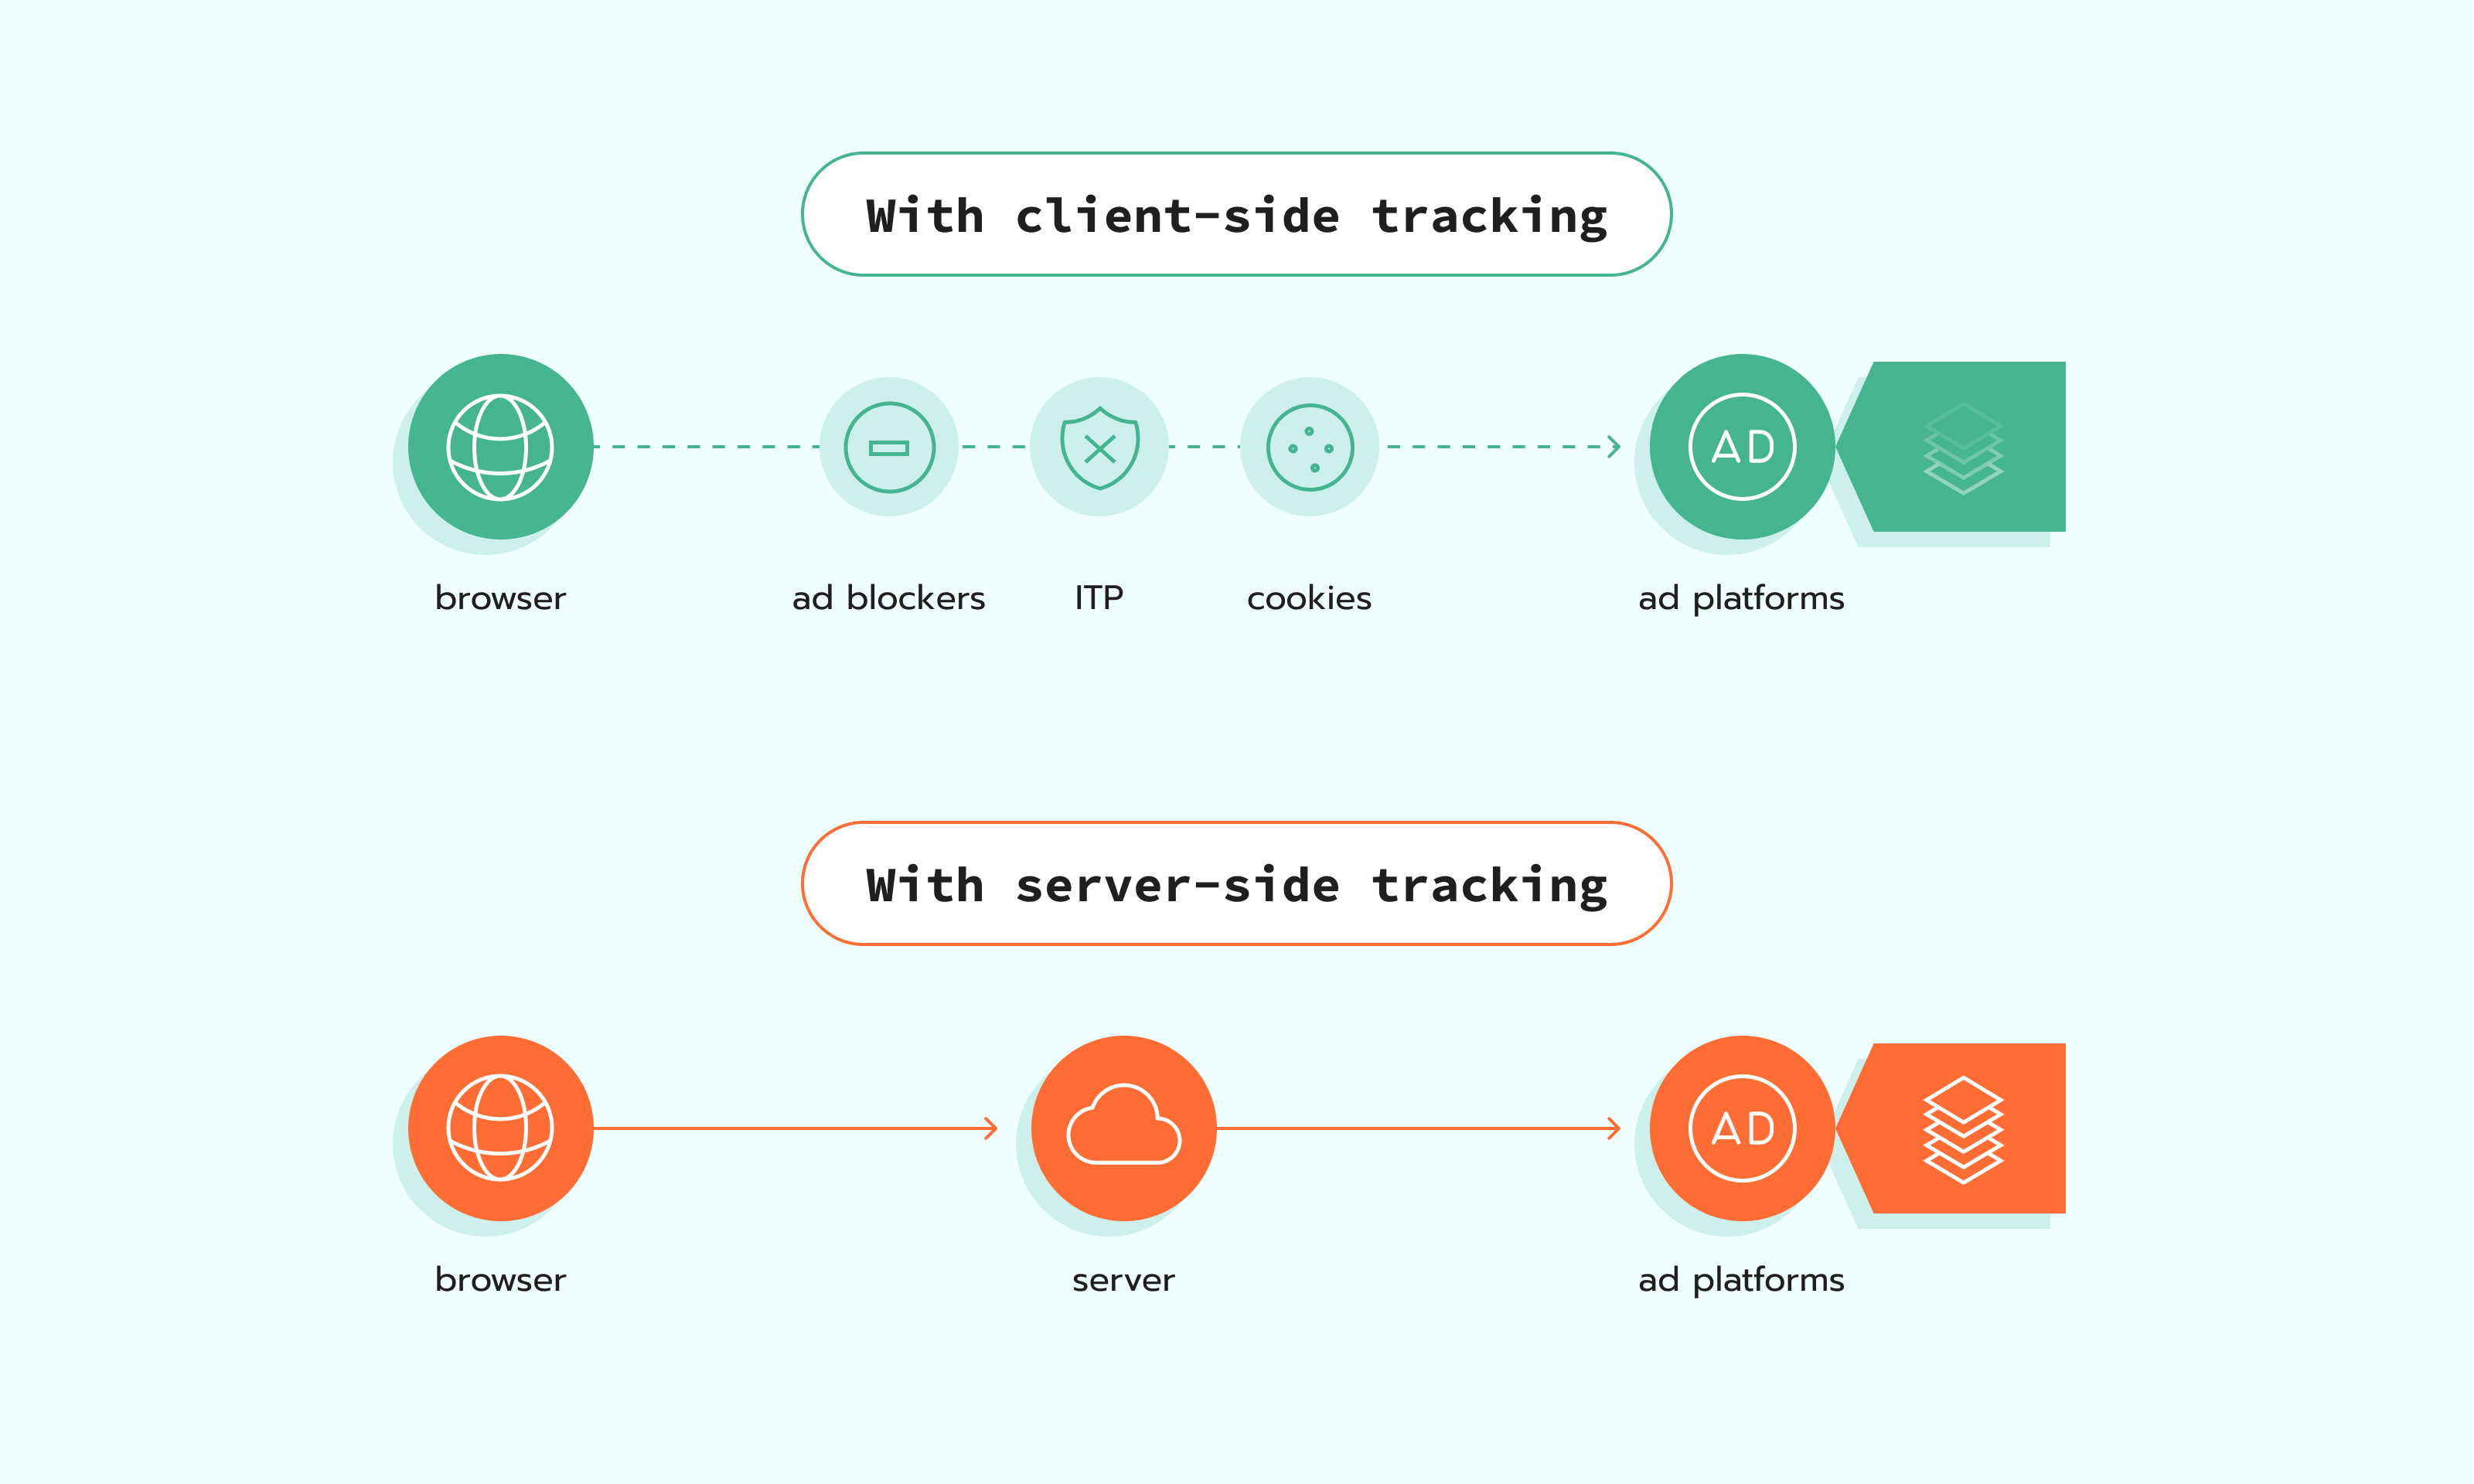
What this gives in practice:
- More complete data in GA4 and ad platforms when ad blockers block or limit some tracking requests.
- More long-lived first-party identifiers because events go through a first-party subdomain.
- Better control over what is sent, when it is sent, and under which consent choice.
- More complete conversion data by connecting website events with backend signals (payments, CRM updates, offline outcomes) and enriching events before they reach GA4 and ad platforms.
- Better visibility and control over what gets sent to each platform, with server-side routing and filtering.
How to measure impact correctly
Before you look at any data, set a few guardrails. It keeps the comparison fair and saves you from long debates later. Pick one measurement method, choose two equal periods, and write down anything that changed during the window, like consent settings, tagging changes, or campaign updates. Also, give reports a little time to settle, so you are not judging results too early.
Pick a measurement method
Start by choosing one way to measure impact. This keeps your report clear and stops people from mixing numbers that do not belong together. Each method answers a slightly different question. Each also has its own limits. Pick the one that you know how to use the best.
Before/after comparison
This is the simplest method. You compare results before server-side tracking and after its implementation. Use it when you need the most practical and easy-to-run approach, or when a clean split test is not possible. The risk is that other changes can affect the numbers at the same time, like campaigns and seasonality.
How to do it well:
- Compare equal periods, with the same weekday and weekend mix.
- Write down any changes during the window: consent, tags, events, budgets, and landing pages.
- Give GA4 and ad platforms time to process data before you report results.
A/B test
When doing an A/B test, you keep the control group on the old setup and move the test group to server-side tracking, then compare the results. The hard part is planning. You need a stable setup and enough data to see a difference.
How to do it well:
- Use a holdout or a campaign split so the control group stays untouched.
- Keep campaigns and creatives stable during the test window.
- Compare business metrics like conversions, revenue, and CPA against the control group.
Geo split
Use this when you can split by country or region: one area keeps the old setup, another gets server-side tracking. This is useful when you do not get many conversions each day, or when sales take time, like B2B lead gen. In these cases, results can jump up and down from week to week just because the numbers are small, and leads can close weeks later. A geo split lets you run the test longer and compare two similar regions side by side.
The risk is that locations can behave differently for reasons you cannot control, like pricing, shipping, or local demand.
How to do it well:
- Pick regions that behave similarly and have similar traffic volume.
- Keep budgets and targeting stable across regions during the test.
- Track results at the country or region level for conversions, revenue, and CPA.
Set guardrails
Guardrails are simple rules you set before you compare numbers. They keep the measurement true and keep your report steady from start to finish. Without them, one person looks at GA4, another looks at an ad platform, and everyone ends up with a different conclusion.
Before you start comparing results, agree on a few basics: match the time periods, log any changes that could influence performance (consent, tagging, campaigns), and account for reporting delays. This keeps the analysis consistent and makes your conclusions easier to defend.
Compare equal periods
To avoid any confusion, you want to match the periods as closely as you can.
Make periods equal in: length, weekday and weekend split, seasonality, and promo intensity. If you must compare uneven periods, say it explicitly and soften the assumptions. Also, make sure that all your platforms follow the same time zone.
Note consent, tracking, and campaign changes
If any of these change during the measurement window, write it down:
- Consent banner behavior or Consent Mode configuration.
- New tags, removed tags, new events, event naming changes.
- New bidding strategy, budget shifts, creative refresh, and landing page changes.
Expect reporting delay windows
If you pull GA4 numbers too early, you will confuse everyone. GA4 explicitly notes that data processing can take 24–48 hours, and that data in reports may change during that time. Google Ads enhanced conversions diagnostics also mentions time windows for status reflection and updates, so don't bring in diagnostics too early.
Define "success metrics" per stakeholder
People can look at the same change and disagree, look at the same numbers and call different things "success." So, agree on this first. Pick the metric each stakeholder will accept. Also, decide where you will check it, and how often. Then you can share results without long debates.
Make one shared doc with a small table:
Stakeholder → metric → where we check it → how often we check it.
Use it as your agreed-upon reference, so the team does not argue about numbers every time.
Proof layer 1: Website Tracking Checker by Stape
Before server-side tracking implementation, run Website Tracking Checker by Stape and save the report. This gives you a baseline with your tracking score and the exact issues on the site.
After server-side implementation, run Tracking Checker again on the same website and compare the new report with the saved baseline report.
This before-and-after view helps you show stakeholders what issues were fixed and how tracking health improved.
Proof layer 2: Stape Analytics
Stape Analytics is a free feature inside the Stape platform that helps you measure the impact of server-side tracking. It visualizes what was recovered and how your tracking coverage changes over time, so you can back up results with numbers.
Stape Analytics gives you visibility into:
- How many events were blocked on the client-side but got recovered with the server-side setup.
- Recovery from Safari / ITP tracking prevention.
- Bot traffic and consent status signals across events.
- Results split by server client, plus trends by day.
Proof layer 3: GA4
Use GA4 or your analytics platform to confirm the changes after server-side tracking implementation: more complete event counts, more stable attribution, and fewer gaps in acquisition and funnels.
Treat the checks below as validation points, not guarantees. One metric can change a lot while another changes a little, depending on the traffic mix and tracking setup.
N.B.: wait 24-48 hours after setup changes, because GA4 updates with a delay. Also, make sure to add some extra time during big marketing campaigns like Black Friday.
More events and conversions logged
Typical issue: GA4 event counts can look lower than expected because some tracking requests are blocked before they reach GA4. This is often linked to ad blockers, short cookie lifetimes, redirect steps, or cross-domain breaks.
What to expect: with server-side routing, more events that already happened on your site are delivered to GA4. The common outcome is a lift in measured events and conversions.
What you will usually see: higher counts for key events (purchase, generate_lead, sign_up) and more stable day-to-day totals.
Keep in mind (what server side can't fix): server-side tracking won't improve GA4 counts if the event never fires (broken tags/JS errors), if GA4 is misconfigured (wrong event names/key events), or if consent prevents measurement.
Drop in Unassigned or Direct traffic
Typical issue: GA4 over-attributes traffic into Direct or Unassigned when it can't reliably connect sessions to source signals (click IDs lost, cross-domain breaks, browser restrictions, redirects, or inconsistent tagging).
What to expect: if your server-side setup preserves key identifiers (and your redirects/cross-domain handling is correct), GA4 can attribute more sessions to their real sources.
What you may see: a shift from Direct/Unassigned into the correct channels, but results vary widely, and you should treat it as a diagnostic signal, not a KPI.
Where to check (GA4): Reports → Acquisition → Traffic acquisition. Compare Default channel group distribution before/after (same window).
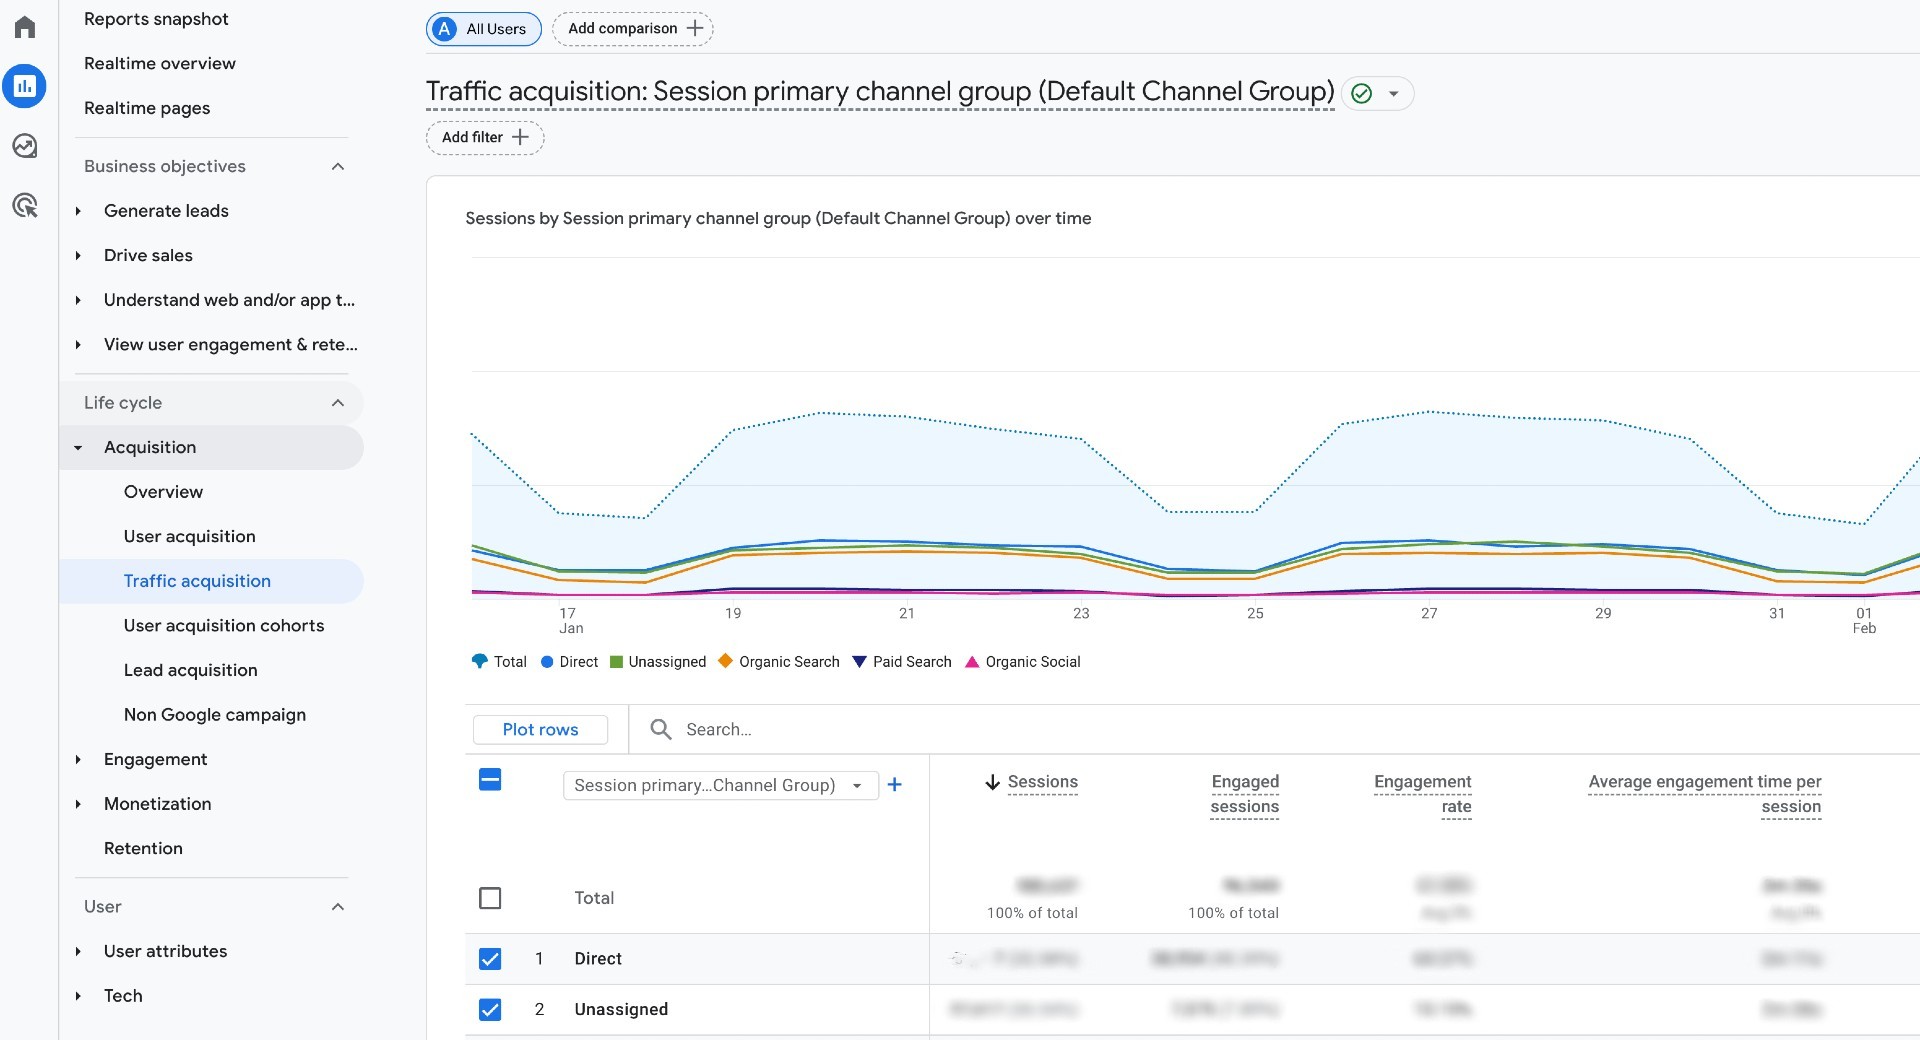
Keep in mind (what server side can't fix): missing UTMs, broken redirect/cross-domain handling, or incorrect Channel Grouping rules. Some Direct is normal (typed URL, bookmarks, many email/app clicks).
More complete eCommerce funnels
Typical issue: funnels break when checkout spans multiple domains/subdomains, payment redirects, or tracking is interrupted near purchase. GA4 can show gaps like add_to_cart and begin_checkout without purchase, or inconsistent revenue reporting.
What to expect: with the right setup, SST can reduce loss around the funnel (better identifier continuity, more reliable request delivery). In many eCommerce cases, the bigger win is adding server-to-server purchase confirmation (backend events) so purchases aren’t missed when browser tracking fails.
What you may see: a more complete purchase journey in GA4 and more consistent purchase counts/value.
Where to check:
- Reports → Monetization → E-commerce purchases.
- Explore → Funnel exploration (Purchase journey).
Note: if revenue stays the same but conversions rise, say it clearly. Explain that measurement became more complete, not that sales grew by default.
Proof layer 4: ad platforms
If you run paid media, validate the impact inside the ad platforms too. This is where you can confirm two things:
- The platform is receiving more complete conversion signals.
- Those signals are usable for attribution and optimization.
In the sections below, we'll focus on the most practical checkpoints per platform (signal quality diagnostics first, then conversion reporting and efficiency trends). Keep your comparison clean by using the same date range and attribution settings before vs. after.
Note: since each ad account, campaign type, and tracking setup is different, you're looking for directional improvements and consistency, not a guaranteed uplift in every metric.
Meta (Facebook ads)
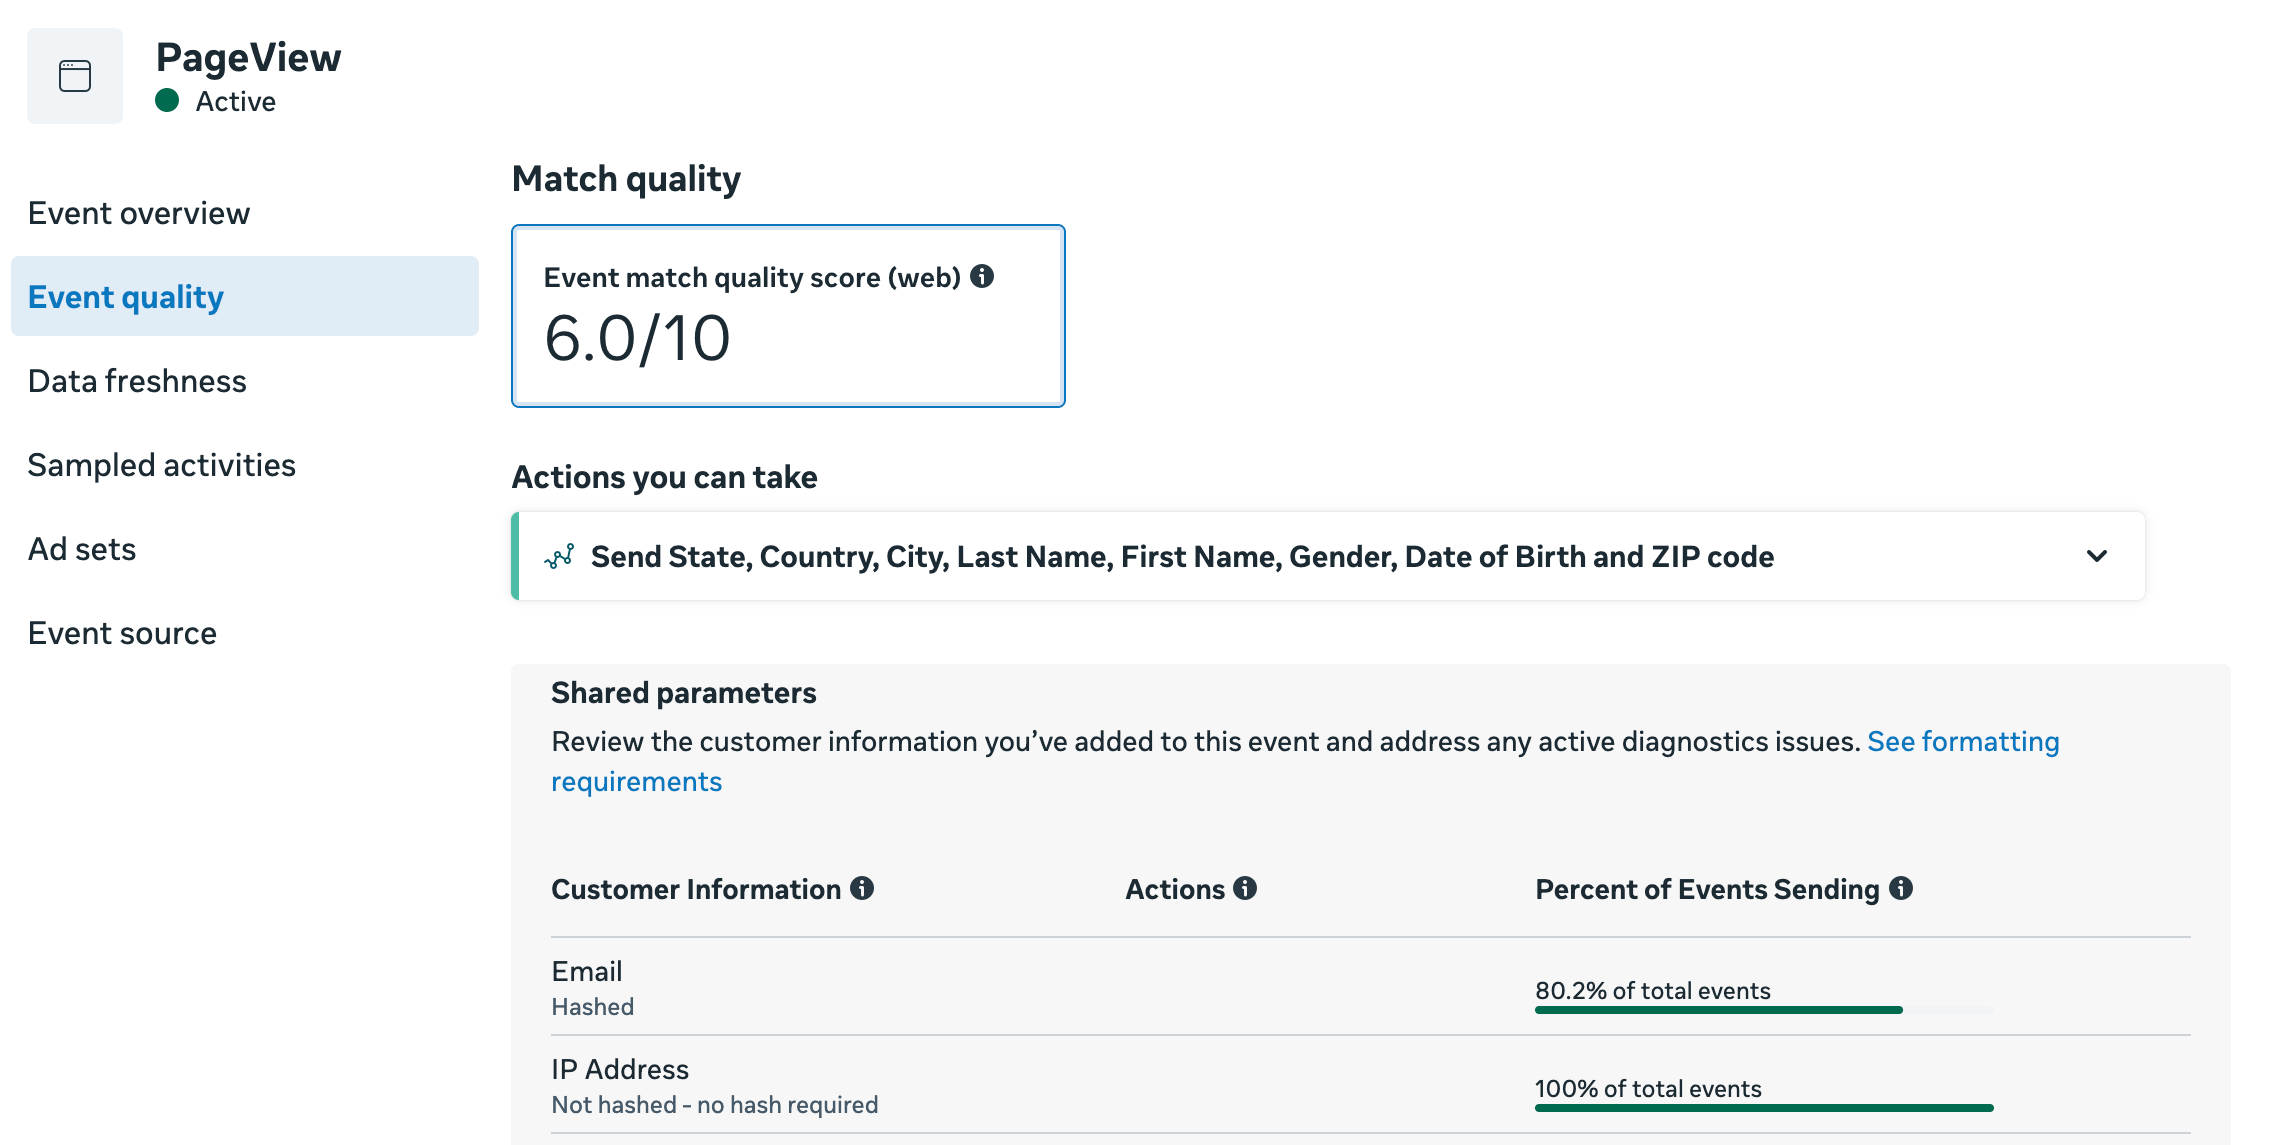
Data quality: EMQ and ODQ
Typical issue: with client-side-only tracking, Meta often receives an incomplete or inconsistent event stream. Some events get blocked (ad blockers), limited (Safari/ITP), or dropped during redirects and cookie expiry. Even when events do arrive, key parameters and identifiers can be missing or unstable. This can lead to weaker data quality signals and lower match rates.
What to expect: with server-side tracking, more events reach Meta reliably and can include cleaner first-party parameters (when available and consented). Over time, you may see improved quality indicators and fewer warnings in Diagnostics, especially for browsers where client-side loss is higher.
Where to check: Meta Events Manager → Data Sources (Pixel/Dataset) → Overview / Diagnostics (and the quality/match indicators shown there).
Keep in mind (what server side can't fix): consent, weak offer or ad creative, wrong audience targeting, slow landing pages, or CRM sales process issues. It also cannot fix events that never fire because of broken tags or wrong trigger logic.
Conversion volume and conversion rate
Typical issue: reported conversions can be undercounted when browser-side events get blocked, or don't reach Meta. Reporting can also look inconsistent if attribution settings change or if you're comparing different campaign mixes.
What to expect: after adding a server layer, Meta often receives a more complete stream of conversion events. This can increase reported conversions and change the conversion rate, not because demand changed overnight, but because fewer conversions are missed in measurement.
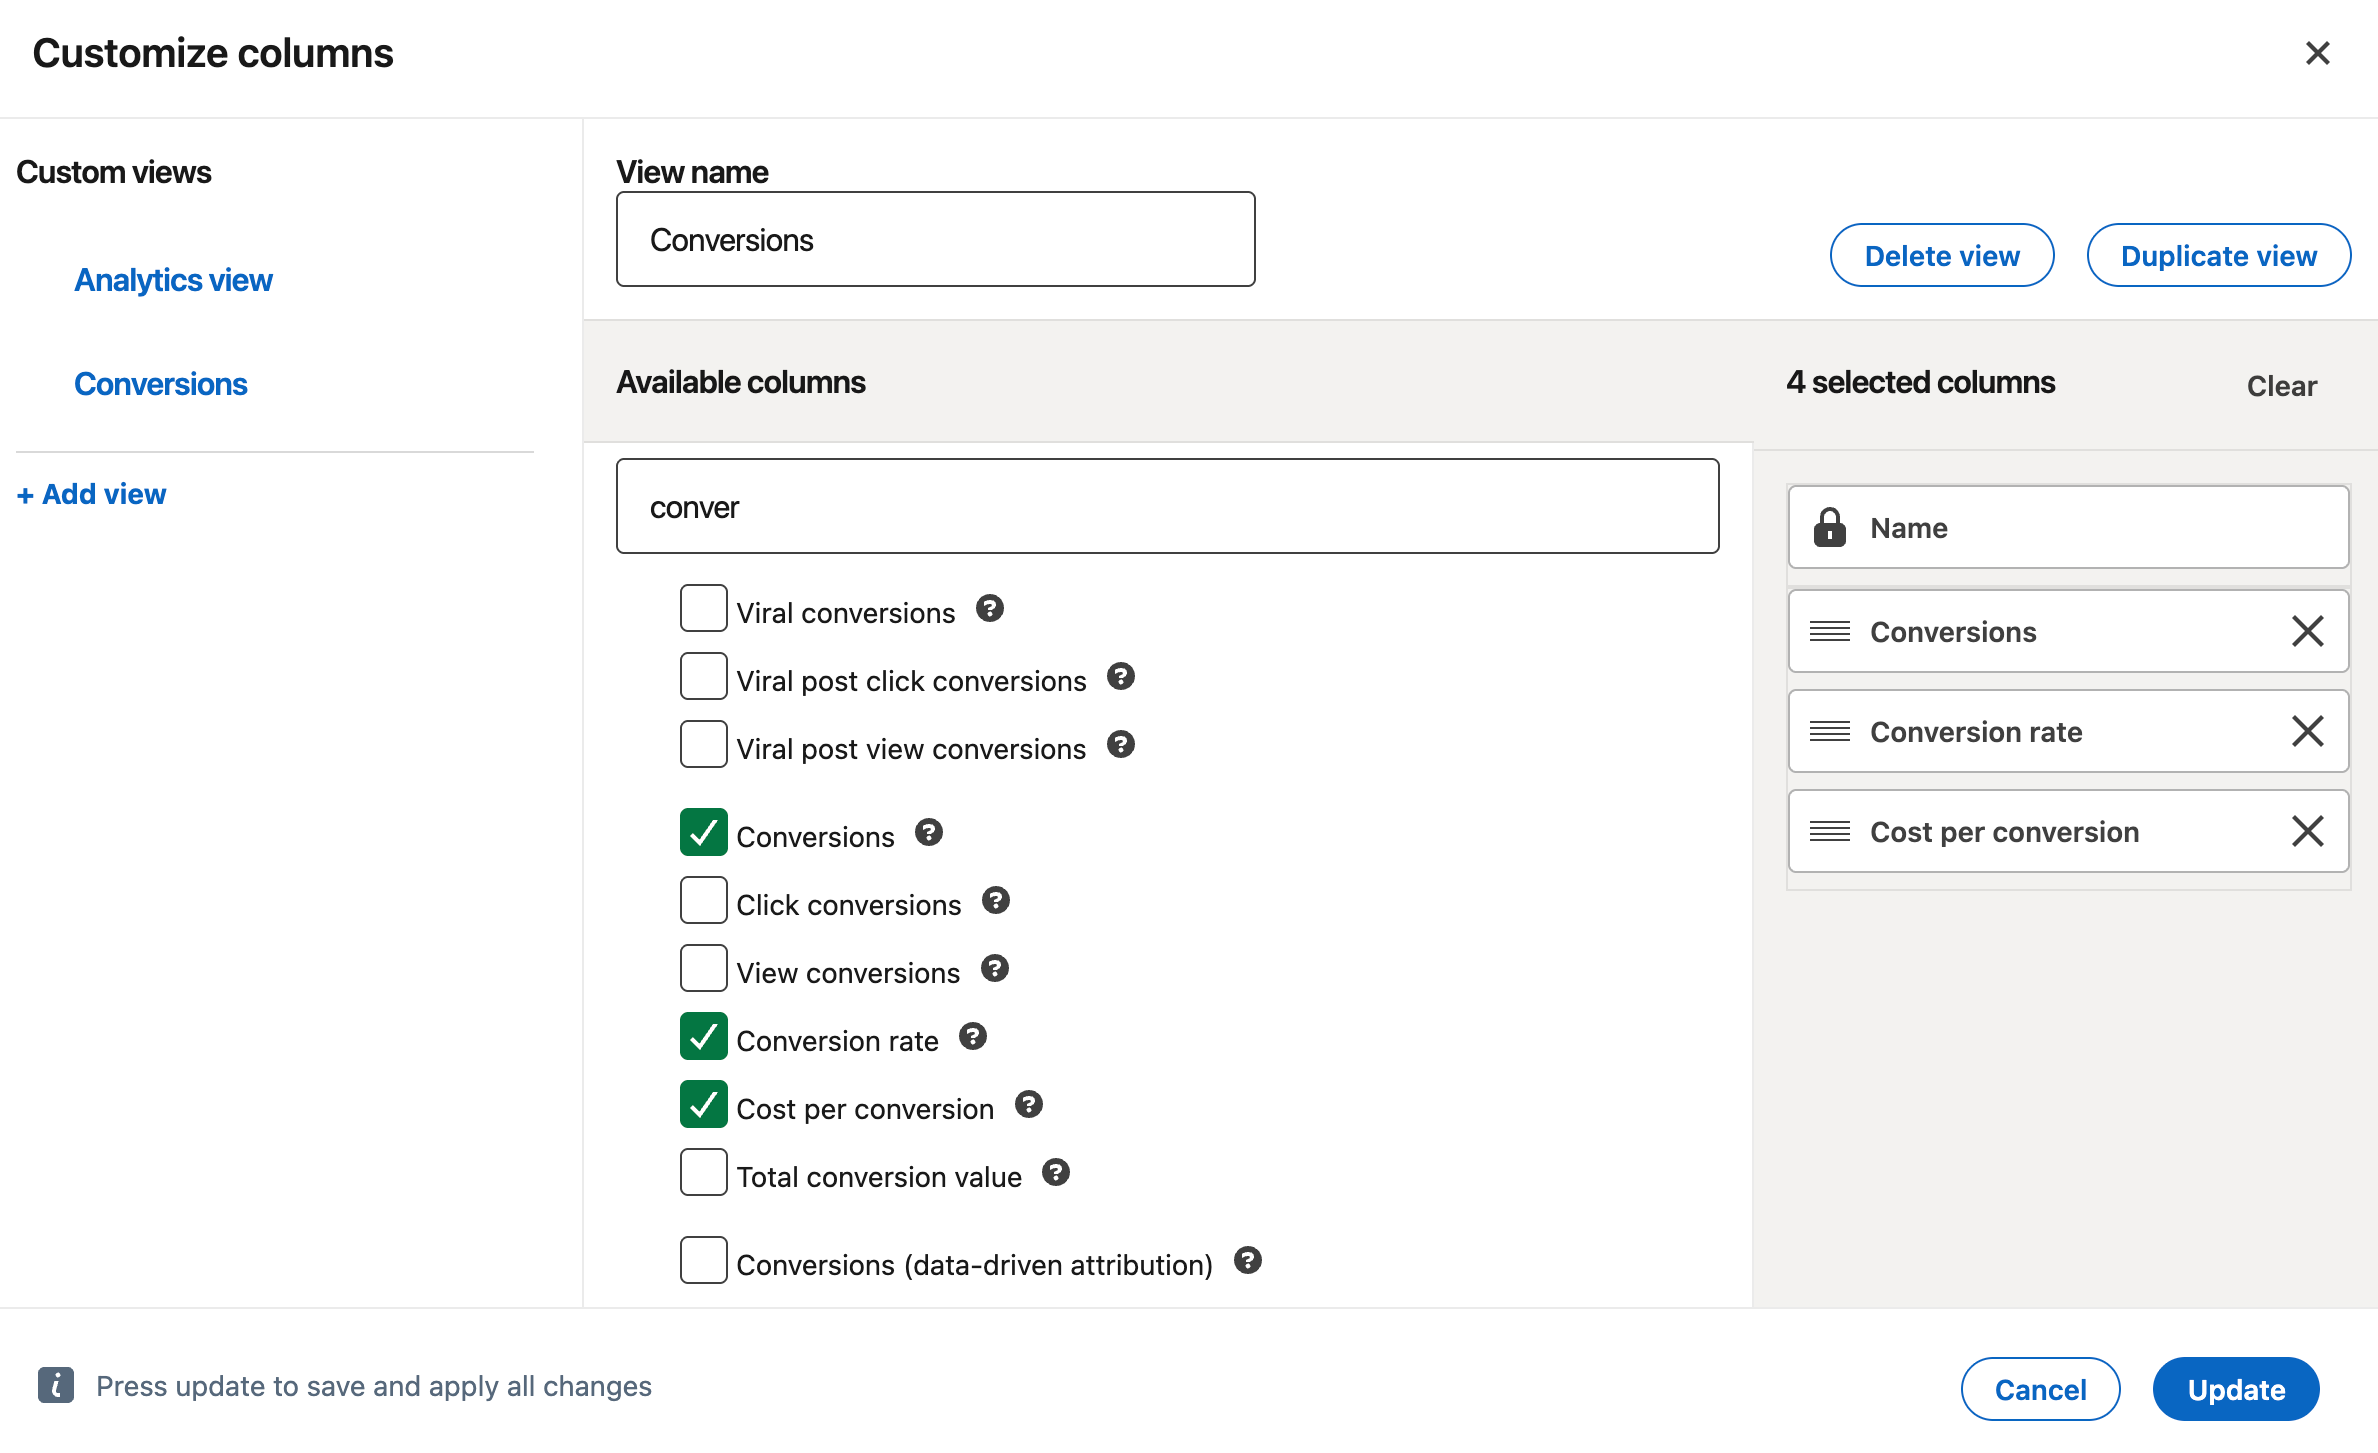
Where to check: Meta Ads Manager → Campaigns/Ad sets → Columns (Conversions, Cost per result, Conversion rate if used). When comparing before/after, keep the same attribution setting and look at the same campaigns where possible.
Keep in mind (what server side can't fix): creative fatigue, audience saturation, offer changes, and landing page issues. Reporting can also change when you change attribution windows or models, campaign objectives, or optimization events. Also, more tracked conversions do not automatically mean more real conversions. It can mean tracking now captures conversions that were missed before.
If you send the same conversion from the browser and from the server, make sure Meta deduplication is set up correctly. Without deduplication, the same conversion can be counted twice, which can inflate reported conversions and distort the conversion rate.
CPA and ROAS trends
Typical issue: with browser-only tracking, Meta can miss conversions and key identifiers. That not only affects reporting, but it also weakens optimization feedback and shrinks retargeting quality. The result can be inefficient delivery (higher CPA, lower ROAS), even if demand hasn't changed.
What to expect: more complete conversion signals can change CPA/ROAS in two ways:
- Reporting effect: Meta attributes more of what already happened, so CPA/ROAS may look better even if the number of actual conversions didn't change.
- Optimization effect (slower): better signals can help delivery learn more consistently over time, which may improve efficiency, especially in accounts that were signal-limited before.
Where to check: Meta Ads Manager → Columns (CPA / Cost per result, Purchase ROAS or custom ROAS columns). Use stable comparison rules: same attribution setting, same time window length, and a change log of campaign edits.
| You can use the ROAS calculator to estimate how server-side tracking could improve your CPA. |
Keep in mind (what server side can't fix):
- Poor campaign strategy or weak creative/offer.
- Broken on-site conversion flow (checkout errors, slow site, payment failures).
- Limited volume (if you don't have enough conversions, learning will still be unstable).
Offline conversions
Typical issue: for longer sales cycles, a lot of value happens after the website session: in a CRM, via a payment link, or offline store. Without stable identifiers and a clean upload process, Meta can’t match those outcomes back to ads.
What to expect: server-side tracking can help you preserve and pass the identifiers you have (e.g., click IDs, event IDs, lead/order IDs) into your backend/CRM, so offline outcomes can be matched more reliably when you upload or integrate offline conversions.
Where to check: Meta Events Manager → Data sources / Datasets → your dataset (offline conversions) → Overview/Diagnostics. Also validate in Ads Manager using columns for the offline conversion event(s), if configured.
Keep in mind (what server side can't fix):
- Offline conversions still need an extra setup step: you need an upload flow or a direct integration to send offline outcomes to Meta.
- Poor CRM hygiene (missing IDs, inconsistent lead identifiers, delayed or incomplete status updates).
- Policy/consent constraints on what data can be sent.
Google Ads
Conversions and conversion rate
Typical issue: with client-side-only tracking, some conversions never make it to Google Ads. In other cases, conversions are sent, but key attribution signals (like click IDs) don't persist reliably, so conversions may be under-attributed or show up in unexpected ways.
How server side can change it: a server-side setup can make conversion sending more reliable and preserve attribution signals more consistently. As a result, you may see more recorded conversions and a conversion rate that better reflects what's actually happening.
Where to check:
- Google Ads → Campaigns → Columns: Conversions, Conv. rate.
- Also: Google Ads → Goals → Summary.
Still influenced by (server side can't fix this): budget/bidding changes, promo periods, creative/landing page changes, attribution settings, and offline/assisted conversions timing can all move these metrics even with perfect tracking.
Enhanced conversions and match rate
Typical issue: even if conversions are recorded, Google can struggle to match them to ad interactions when identifiers are missing or inconsistent (limited cookies/click IDs, partial form data, inconsistent hashing, or missing user-provided data). In client-side-only setups, the matching signals are often less consistent.
How server side can change it: server-side tracking can help you pass matching signals more consistently (including server/CRM-sourced identifiers where appropriate), which can improve Enhanced Conversions diagnostics and match-related indicators over time.
Where to check: Google Ads → Goals → Summary → Diagnostics.
Still influenced by: how many users submit identifiable data (email/phone), form completion rate, consent, your tagging/hashing correctness, and whether the conversion action is configured properly.
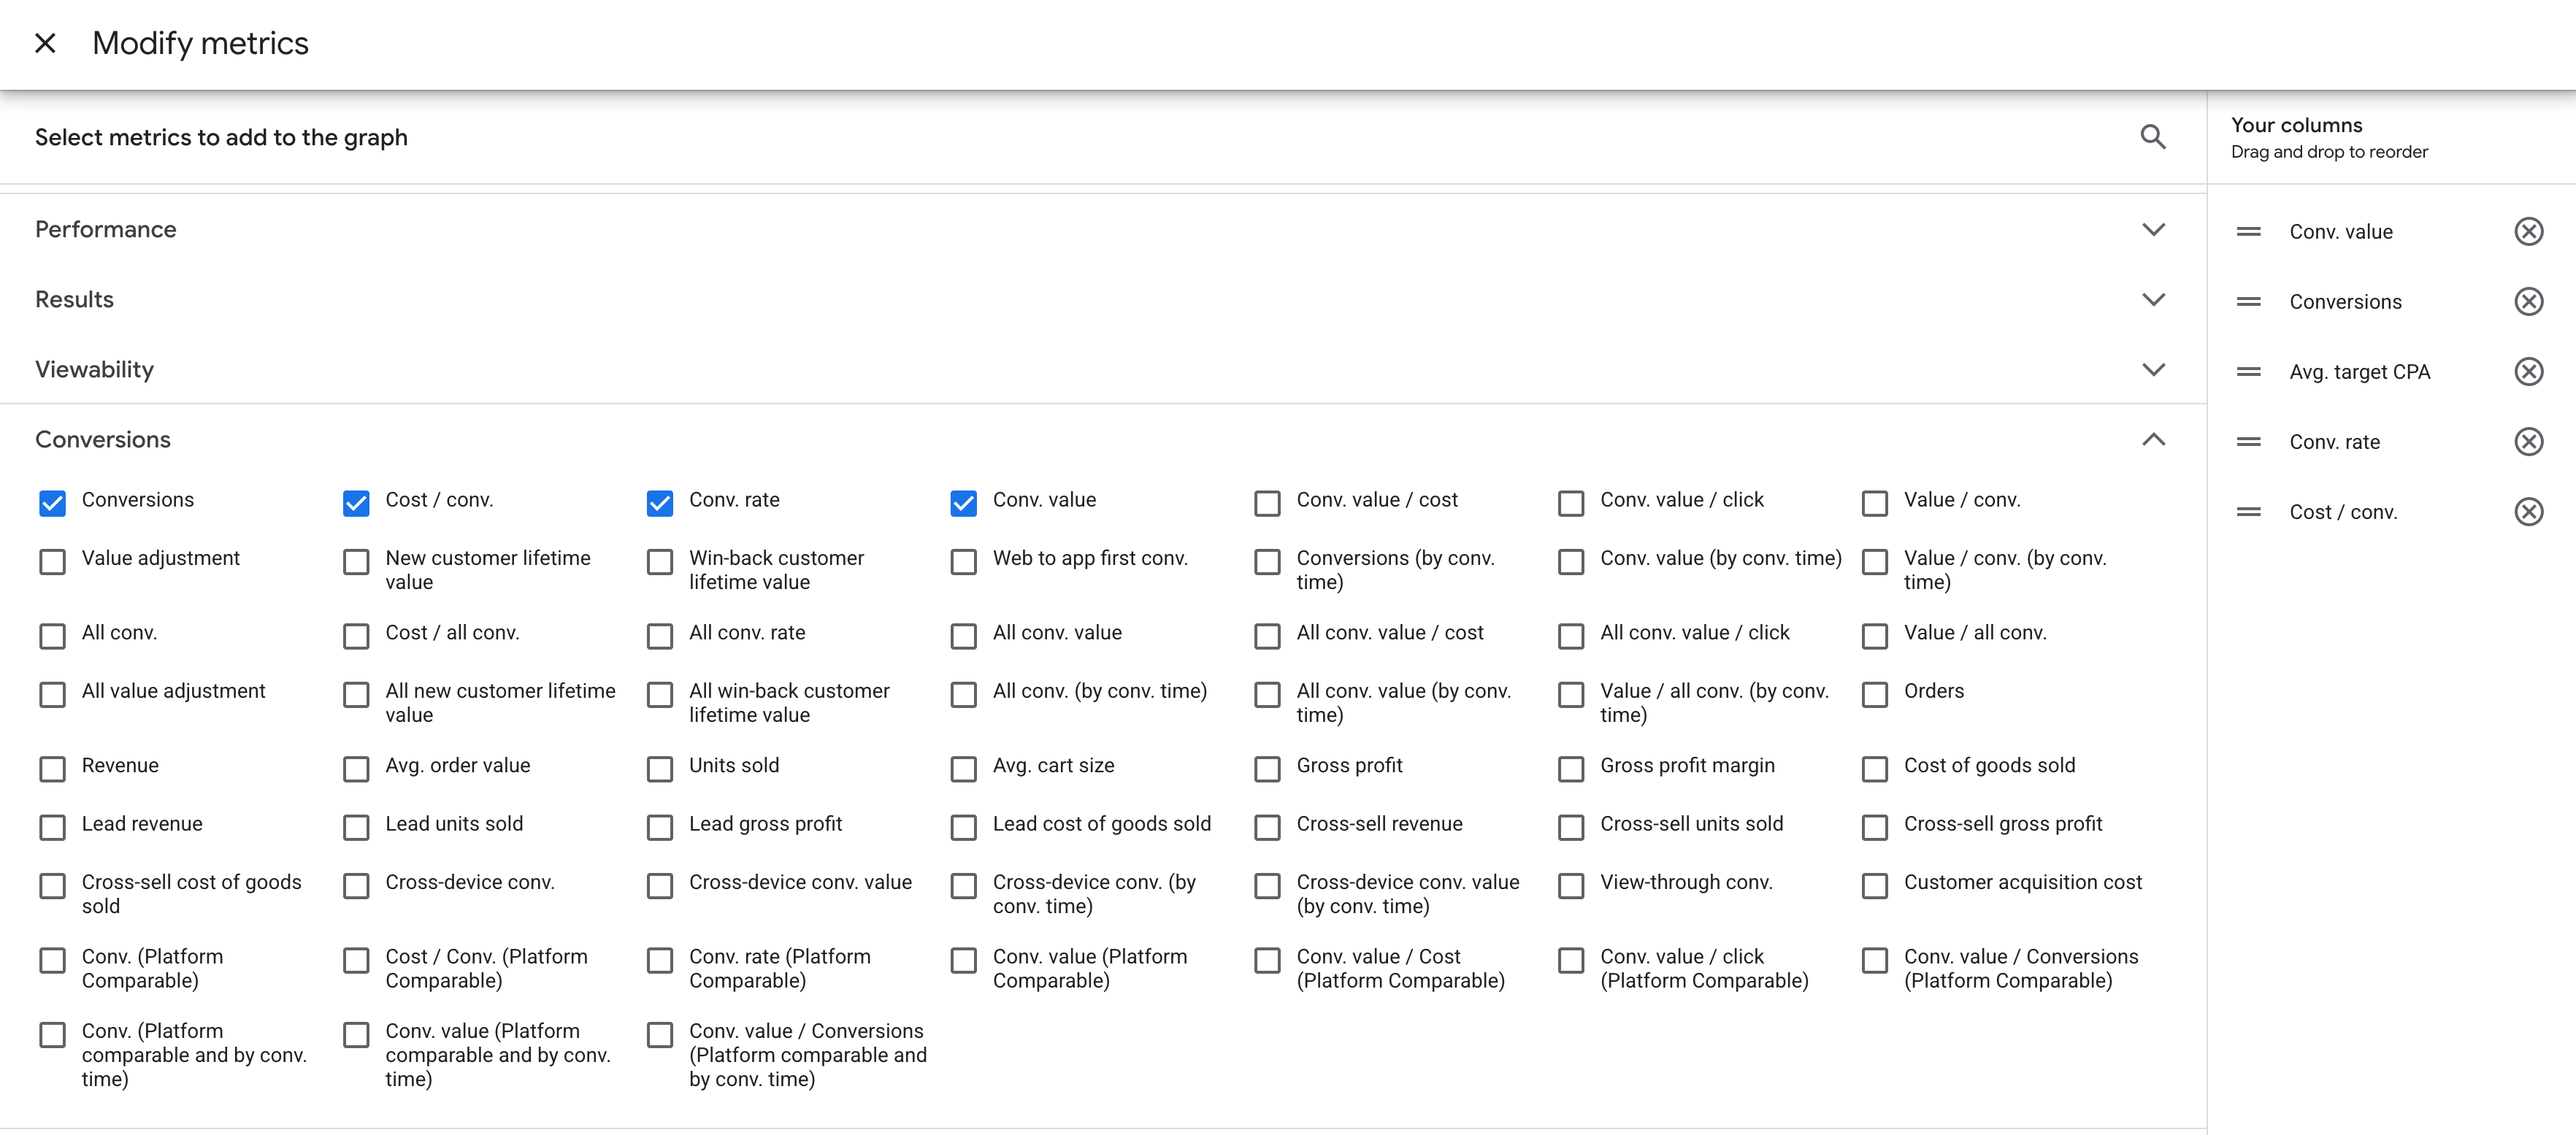
CPA and ROAS trends
Typical issue: when conversions aren't fully captured client-side, CPA and ROAS can look worse because Google Ads is missing part of the outcomes. And also, Smart Bidding is learning from incomplete inputs, which can reduce efficiency and make performance more volatile.
How server side can change it: server-side tracking can increase conversion coverage and keep identifiers more stable, giving Google Ads stronger inputs for bidding and targeting. That can improve reported performance and sometimes efficiency over time, but results vary widely by account maturity, conversion volume, and campaign mix.
Keep notes about budget, ads, and targeting changes in the same period, because these changes can also move CPA and ROAS, and you do not want to mix campaign changes with tracking impact.
Where to check: Google Ads → Campaigns → Columns: Cost / conv., Conv. value/cost.
If you use Smart Bidding: Tools → Budgets & bidding → Bid strategies.
Still influenced by: bidding strategy changes, learning periods, audience/targeting shifts, creative fatigue, seasonality, pricing/stock changes, and attribution window/model settings.
Conversion status and match rate
Typical issue: with client-side-only tracking, LinkedIn may receive fewer events, or receive them without enough matching context. This often shows up as:
- Active: low match rate.
- No activity (events stop coming through).
- Events firing but not being attributed reliably.
How server side can change it: server-side tracking can make delivery more consistent and help preserve key identifiers, so fewer events get lost. That can improve conversion status signals and match-related indicators over time.
Where to check: Campaign Manager → Measurement → Conversion tracking → Status column (click into status for details).
Still influenced by: conversion setup quality, event parameter completeness, consent rates, browser mix, and whether the conversion action is configured correctly (URL rules, event rules, deduplication if applicable).
Reported conversions, conversion rate, and cost per conversion
Typical issue: if LinkedIn misses conversion events, reporting can undercount results, and Cost per conversion can look worse than reality. At the same time, these metrics are also highly sensitive to campaign changes, so it's easy to confuse tracking impact with performance improvement.
How server side can change it: when more conversions are captured and matched, LinkedIn may report a higher conversion volume and a conversion rate closer to reality. That can shift CPA/CPL and other efficiency metrics, sometimes immediately in reporting, and sometimes gradually as the platform learns from better signals.
Where to check: Campaign Manager → Advertise → Campaigns → Columns → customize: Conversions, Conversion rate, Cost per conversion.
If you send values, add Conversion value / Return on ad spend where relevant.
Still influenced by: budget, bidding strategy, targeting, creative refresh, audience fatigue, seasonality, and attribution window/model settings.
CPA and ROAS trends
Typical issue: if conversions are underreported or poorly matched, LinkedIn can overstate cost per conversion and understate return. Limited conversion feedback also makes optimization and retargeting less reliable — especially in B2B, where volumes are smaller, and the funnel is longer.
How server side can change it: server-side tracking can make conversion delivery and matching more stable, which can improve both measurement and optimization signals. The effect depends on volume, conversion lag, and how much tracking loss you had before.
Where to check it: in LinkedIn Campaign Manager → Campaigns, customize columns to include Cost per conversion (or CPL), Conversions, and (if you pass value) Conversion value / ROAS. If you use longer-cycle measurement, also review your attribution/reporting settings and compare the same campaigns across the same date windows.
Still influenced by: audience quality and targeting, creative refresh/fatigue, landing page speed and form friction, lead quality (and offline qualification), attribution window/model changes, budget/bid strategy shifts, seasonality, and conversion lag (common in B2B).
Snapchat
Event Quality Score (EQS)
Typical issue: with client-side-only tracking, Snapchat can miss events or receive them without the details it needs to confidently match and use them. That often shows up as a lower EQS.
How server side can change it: server-side tracking can make event delivery more consistent and preserve key parameters, so EQS may improve once the setup is stable and sending enough volume.
Where to check: Snapchat Ads Manager → Events Manager → select your Pixel / Conversions API setup → Event Quality Score (EQS).
Still influenced by: event parameter completeness, event mapping quality, deduplication setup (if you send both browser + server), consent rate, and whether you're sending enough volume for Snapchat to evaluate.
Conversions and conversion rate
Typical issue: if events drop on the way to Snapchat, the platform reports fewer conversions. And so the conversion rate can look lower than reality.
How server side can change it: if more conversion events consistently reach Snapchat, reported conversions can increase, and the conversion rate may shift because the platform is counting a more complete set of outcomes.
Where to check: Snapchat Ads Manager → Campaigns → Columns → add your key conversion (Purchase/Lead/etc) + Conversion Rate.
Still influenced by: attribution window/model, campaign mix (prospecting vs retargeting), budget shifts, creative changes, and landing page changes.
CPA and ROAS trends
Typical issue: tracking gaps can undercount results, pushing CPA up and ROAS down. At the same time, weaker conversion feedback can reduce optimization quality and audience building, which may hurt efficiency in real delivery.
How server side can change it: server-side tracking can stabilize conversion reporting and strengthen the data Snapchat uses to optimize and retarget. That can shift CPA/ROAS and sometimes improve efficiency over time, but it depends on spend, conversion volume, and campaign type.
Where to check: Snapchat Ads Manager → Campaigns → Columns → Cost per action (CPA) and ROAS (if value is sent).
Still influenced by: bidding strategy changes, learning phase resets, creative fatigue, targeting changes, seasonality, and whether purchase value is sent consistently.
TikTok
EMQ
Typical issue: TikTok can receive events, but still struggle to match them reliably when identifiers or event parameters are missing/inconsistent. That often shows up as lower EMQ and weaker optimization signals.
How server side can change it: server-side delivery can make events more consistent and complete, which can lift EMQ over time. A higher EMQ generally means TikTok can match more events and use them more effectively for attribution and optimization.
Where to check it: TikTok Ads Manager → Events Manager → EMQ (inside your Pixel / Events setup).
Still influenced by: consent rate, which events you're sending (and with which parameters), deduplication setup (if you send both browser + server), event volume (low volume = noisier signals), and changes to event mapping.
Conversions and conversion rate
Typical issue: with browser-only tracking, conversions can be undercounted (especially in privacy-restricted environments), and the conversion rate can look artificially low. It can also fluctuate more because small tracking losses have a bigger effect on the reported totals.
How server side can change it: more consistent event delivery can increase the share of real conversions TikTok receives, which improves reporting completeness and can stabilize conversion rate trends, especially when previously lost events start coming through.
Where to check it: TikTok Ads Manager → Campaigns → Columns → add Conversions (your chosen action) and Conversion rate.
Still influenced by: attribution settings (window/model), campaign mix and objective changes, creative fatigue, landing page speed/UX, audience quality, and conversion lag.
CPA and ROAS trends
Typical issue: when TikTok sees fewer or lower-quality conversion signals, it can both undercount outcomes and have a weaker feedback loop for optimization. That can lead to less efficient delivery (higher CPA/lower ROAS), especially for retargeting and value-based optimization.
How server side can change it: more reliable conversion signals can improve both what TikTok reports and what it can optimize toward. Over time, better signal quality can help the algorithm find higher-intent users and build stronger retargeting pools, which may improve CPA and ROAS, but results vary a lot by spend level, event volume, and campaign type.
Where to check it: TikTok Ads Manager → Campaigns → Columns → add CPA (or cost per result) and ROAS (if you send value).
Still influenced by: budget/bidding changes, creative refresh, audience targeting, offer/price changes, site conversion rate, seasonality, and changes in attribution settings or conversion definitions.
What to expect from server-side tracking
There is no fixed "good result" number you must hit. Outcomes depend on things like where traffic comes from, which browsers people use, redirects and payment pages, click IDs, and how much of the setup you moved to server-side tracking. This is why a metric might change a lot in one case and barely move in another.
If you do not see a clear change in one metric, that is normal. Treat the sections above as your checklist. Start with the signals most likely to change, then zoom in on what actually moved and tie it back to the recovery patterns you saw.
The case studies below can also help you set expectations and interpret results. They show what changed and how it was measured.
| Proof angle | Case study | What changed | How they measured it |
|---|---|---|---|
| Revenue impact | 100% orders tracked, +55% conversions, +56% revenue | MCB | Full order tracking, conversion growth, and revenue growth after server-side tracking rollout. | They compared tracked orders and revenue against real business outcomes (including Google Ads vs actual bank revenue), and tracked cost/return changes at product level. |
| Lead tracking lift | 10% to 85% of leads tracked | MCB | Lead tracking improved from about 10-15% to 80-85%; click IDs and UTMs were kept through the funnel. | Before/after lead tracking rate comparison and persistence checks for UTMs and click IDs across the CRM flow. |
| Cost efficiency | 3x lower sGTM costs: Stape vs Google Cloud Run | Analyzify | Effective cost dropped to €0.083 per 10k page_view requests vs €0.25 on optimized Cloud Run. | Direct benchmark of real request and cost data across setups in Oct 2025. |
| Media efficiency + match quality | 39% lower Google Ads CPA and 9+ Meta Match Quality | TDS | GA4 purchases increased (1,724 to 4,512), Meta match quality rose (0-5 to 9+), and Google Ads cost per purchase dropped by 39.39%. | Before/after comparison inside GA4, Meta, and Google Ads after rollout. |
| Data recovery in events & conversions tracked | 24% more Google Ads conversions from a 4.5-month A/B test | seoplus+ | Google Ads conversions increased from 1,000 to 1,242 (+24.18%); 12% interactions were recovered. | Control vs test setup on the same traffic, with Stape Analytics validation over 90 days. |

Comments