
Logs
The Logs feature in the Stape account helps you monitor all incoming and outgoing requests within your server-side container. With its help, you can quickly identify potential errors and start fixing them before they affect your performance.
❗Note: the feature is available for the Pro or higher plans only.
To get started, log in to your Stape account, open your container, and navigate to the Logs tab:
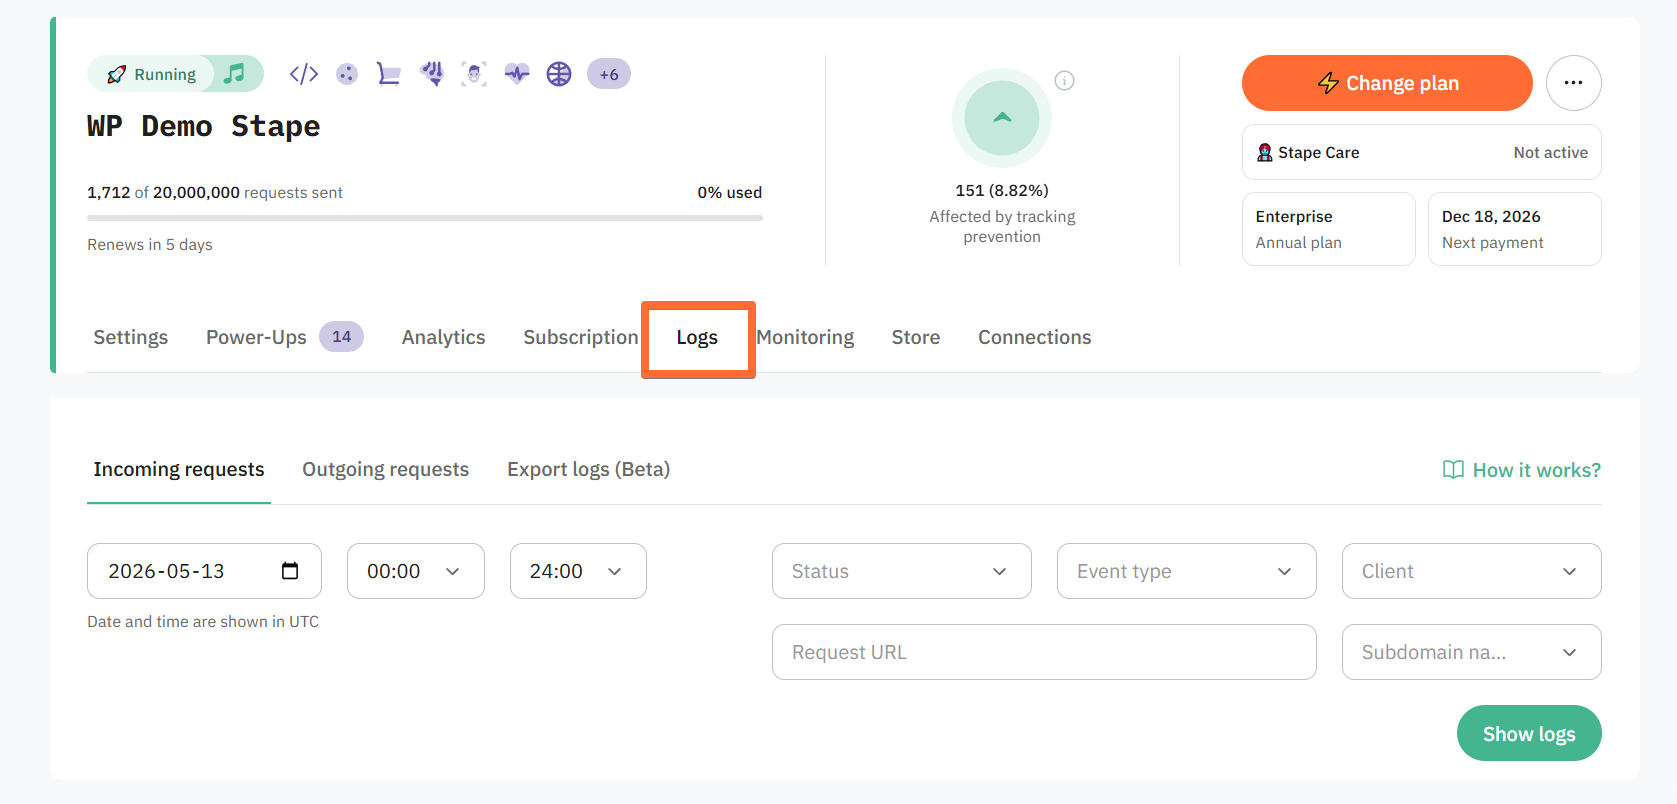
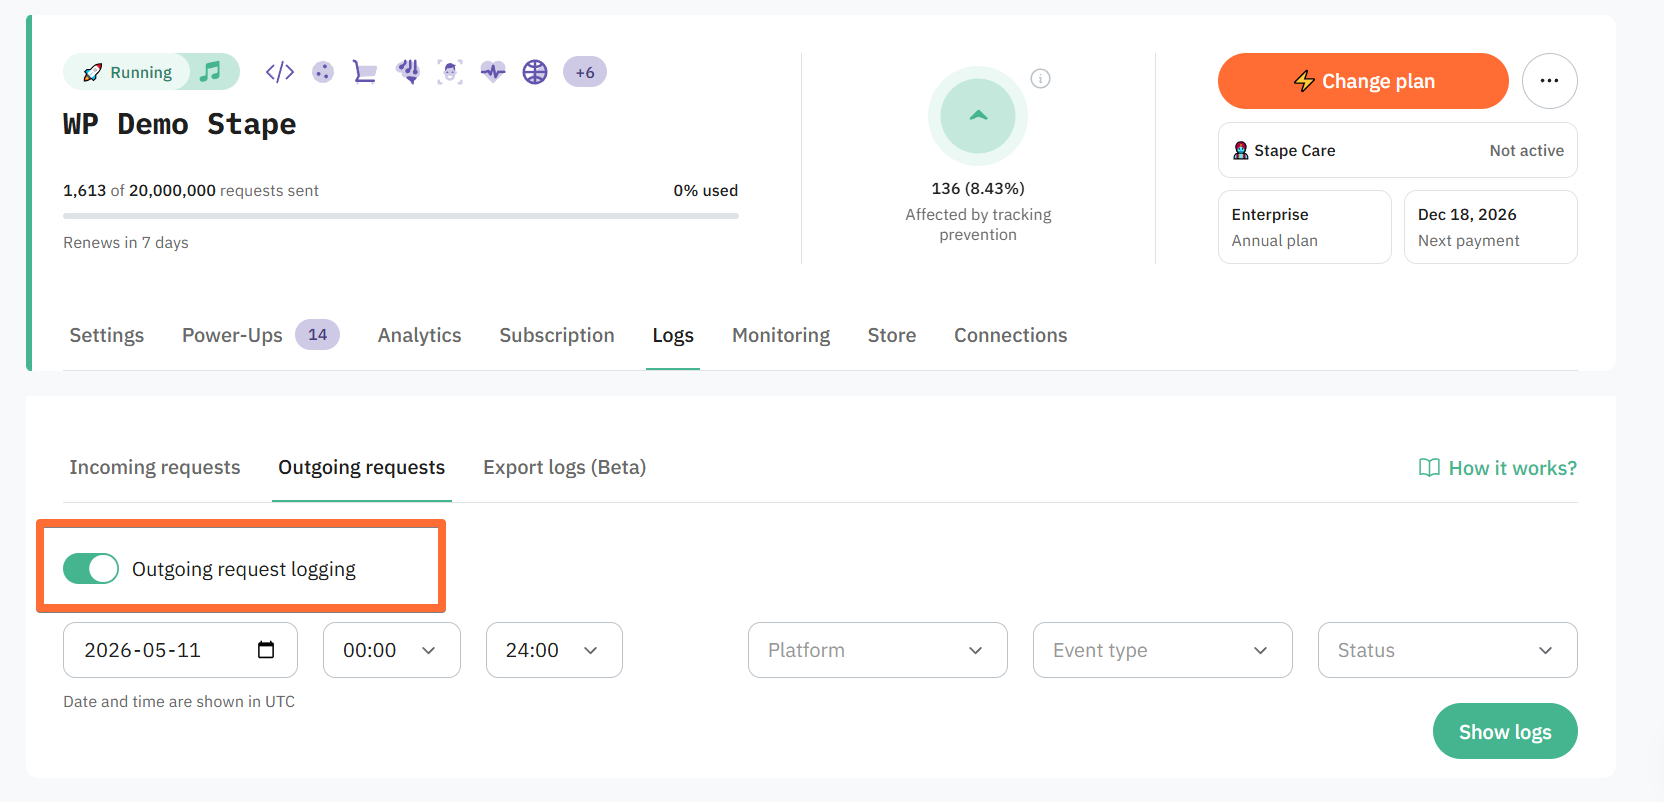
The incoming requests are logged by default. To display outgoing requests, you will need to activate the feature. Outgoing requests may contain sensitive data, so we need your consent to log them.
How the Logs feature works
After enabling the feature, Logs capture and display every HTTP request processed by your server GTM. The feature provides data on the following requests:
- Incoming (the ones that your server GTM container receives)
- Outgoing (the ones that are sent to third-party platforms from your server GTM container)
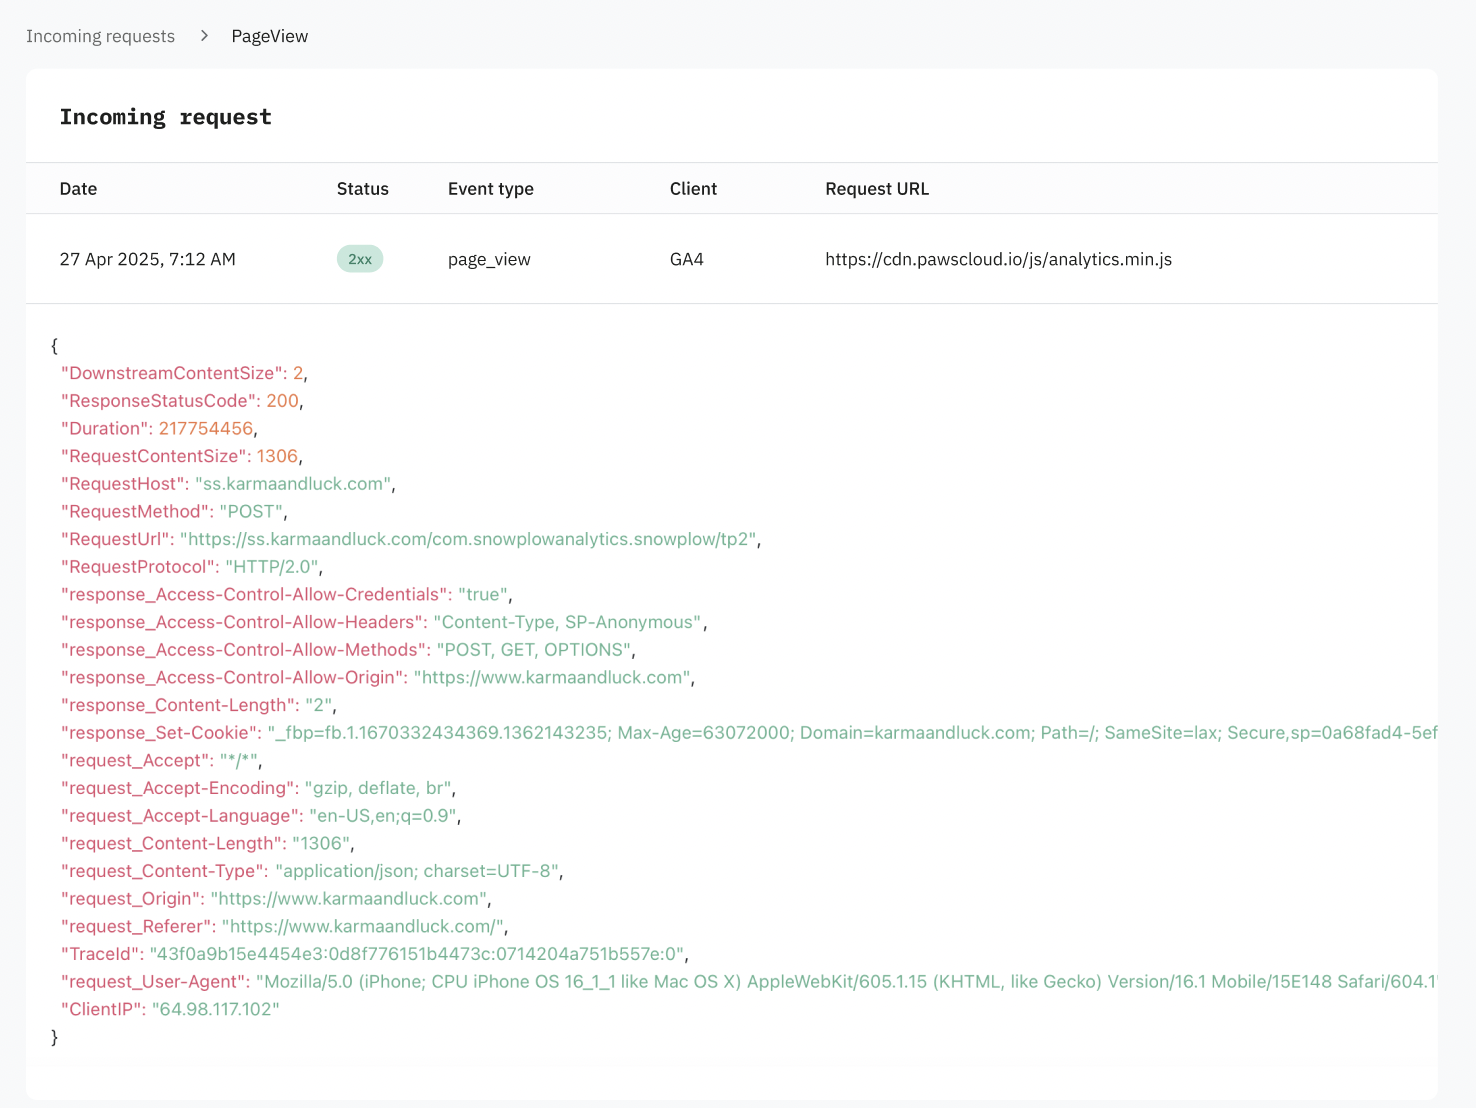
For easier debugging, if you click on the request, the feature shows its details:
You can also enable the ability to Export logs (available for Enterprise plans or higher). This will automatically export your incoming and outgoing (if configured) logs to a cloud storage of your choosing. To activate log export, toggle the switch and enter the required information to connect Stape Logs to your cloud storage.
Benefits of the Logs feature
- Identify and fix tracking issues before they affect performance. Use detailed request and response logs to monitor events sent through your server container so you can quickly detect errors. This reduces incorrect reporting that can impact campaign optimization.
- Make a server-side tracking setup troubleshooting easier. Use logs to inspect payloads, headers, and platform responses at every step of configuration. This reduces guesswork, shortens testing cycles, and helps your team launch tracking faster with fewer errors.
- Detect vendor or network issues early. Use response codes and error messages in logs to identify delays, rejections, or processing issues from connected platforms. This allows you to quickly address misconfigurations or optimize requests when needed.
Check your data flow in action now!
Useful links
Related to this solution
Benefits of Stape hosting for server Google Tag Manager
Discover Stape's sGTM hosting advantages: power-ups for ad blocker bypass & data enrichment, auto-connect custom domains, autoscaling, API, and more.
Troubleshooting server-side tagging using server GTM logs
Learn how to troubleshoot server-side tagging using server GTM logs. Diagnose issues with requests, missing data, and vendor responses to optimize the setup.
How to effectively use GTM Tools by Stape
Initially created by Simo Ahava, GTM Tools is now managed by Stape. Find out the tool’s benefits and how to use it.