Troubleshooting server-side tagging using server GTM logs
Ira Holubovska
AuthorSetting up server-side tagging can be an uphill battle. Except for configuring a tagging server for your sGTM, there are so many different clients, tags, variables, and triggers that need tweaking to work seamlessly.
In this blog post, we want to talk about server GTM logs and how logs help diagnose problems with server-side tagging.
Server GTM logs
Stape Logs is an essential tool to use when setting up server-side tagging. It can help you troubleshoot any problems with requests, missing data, or even determine how the vendor processed a request.
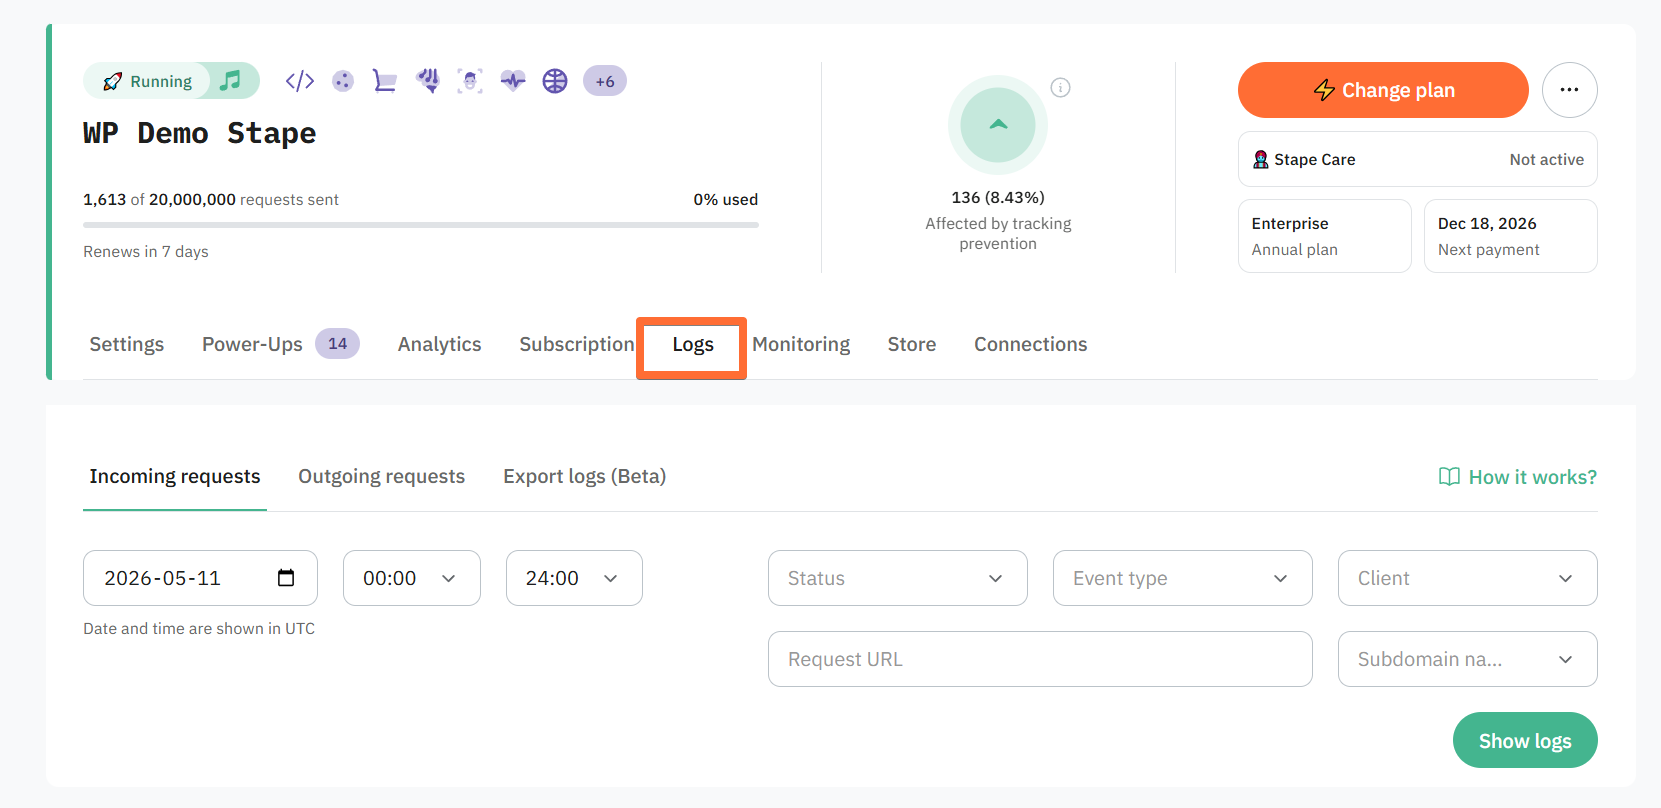
Stape paid plan offers several types of requests for users to view:
- Incoming requests (those that your server GTM container receives)
- Outgoing requests (those that are sent to third-party platforms from your server GTM container)
Stape's Pro and Pro+ plan users get access to logs for the last 3 days. And for Business and higher plans - logs are available for the last 10 days. Each type of log has its own filter options like date range or client name, which will help ensure specific events don't get lost among others - perfect when you need quick troubleshooting. Downloading those requests onto CVS is also possible.
The Export logs feature is available for Enterprise plans or higher.
We have a detailed guide on Stape's Logs feature, its functionality, and configuration.
Server GTM logs use cases
There are countless situations when server Google Tag Manager logs can help troubleshoot server-side tagging setup. Here are just four of the many ways that it will help you out.
1. Fewer purchases in the analytics platform than in the CRM. You can troubleshoot this issue by going to Log, filtering all Outgoing requests, and checking if all purchase events were processed successfully (status 200).
2. Suspect that Facebook Ads manager attribution doesn't work correctly. If you think that FB attribution doesn't work correctly, the first thing that you would want to verify is if Facebook CAPI sends the fbc and fbp parameters via Stape Logs.
| For a detailed guide on how to troubleshoot these tracking issues, refer to our guide on data discrepancies causes. |
3. Event is missing a parameter. You've noticed that some purchases in Google Analytics miss the purchase value. In this case, the Logger tag can help to troubleshoot this error. We will show how to use the Logger tag later in this blog post. But the main idea is that you set up a tag in sGTM that triggers the purchase event when the purchase value is 0. You can add a custom name to this event and later check it inside the Stape Logs section.
4. Logging POST requests body. Server GTM logs have two request types POST and GET. POST request body is not available by default in Google Cloud or Stape logs. If you need to see more details about POST requests, use Logger Tag and enable Log Request Body in the tag settings.
Set up Logger tag in sGTM
The Logger tag for server-side Google Tag Manager (sGTM) helps track and debug requests sent to your server container. It allows you to log event data, request details, and custom information to Stape Store, GCP, BigQuery, or other cloud platform logs. This tag also allows logging of POST request bodies, which are not included in logs for GCP or Stape by default.
Note that the tag doesn't log responses to requests made within sGTM, because it's not possible for this tag to access them. You can alternatively achieve this using the logging section in Stape's tag templates.
1. Go to your Google Tag Manager server container → open the Tags section → click New.
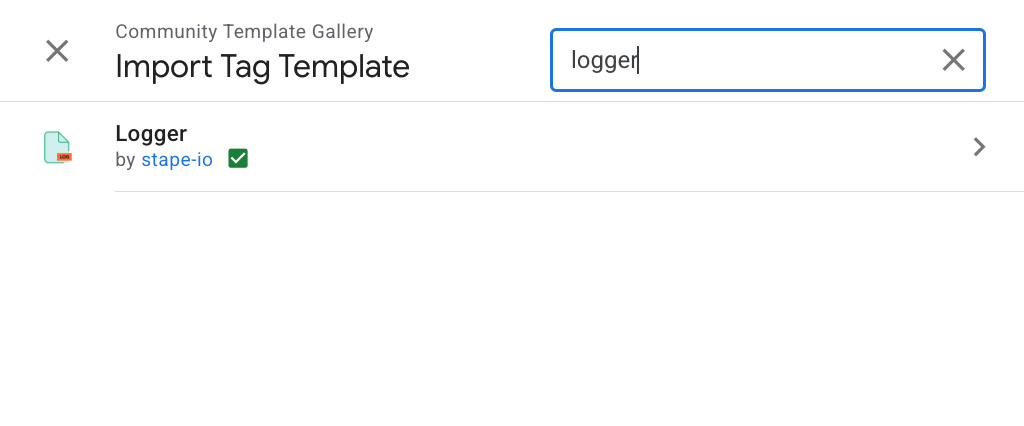
2. In the pane that opens → click Discover more tag types in the Community Template Gallery → search for Logger → click on the Logger tag by stape-io → click Choose template.
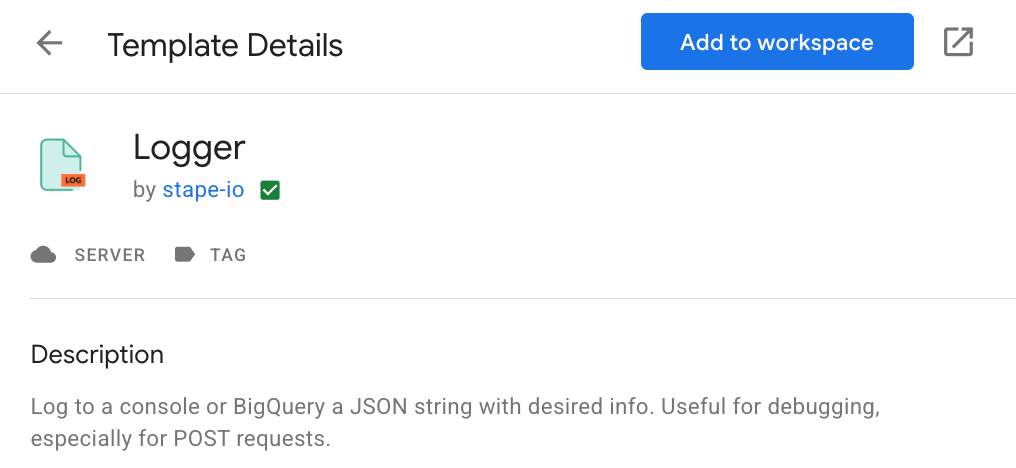
3. Create a new tag in the server GTM. As a tag type, choose Logger.
4. Launch sGTM debugger and test the Logger tag. Once the tag is triggered go to your sGTM Container → click Logs → Other Logs → add event name → apply filter.
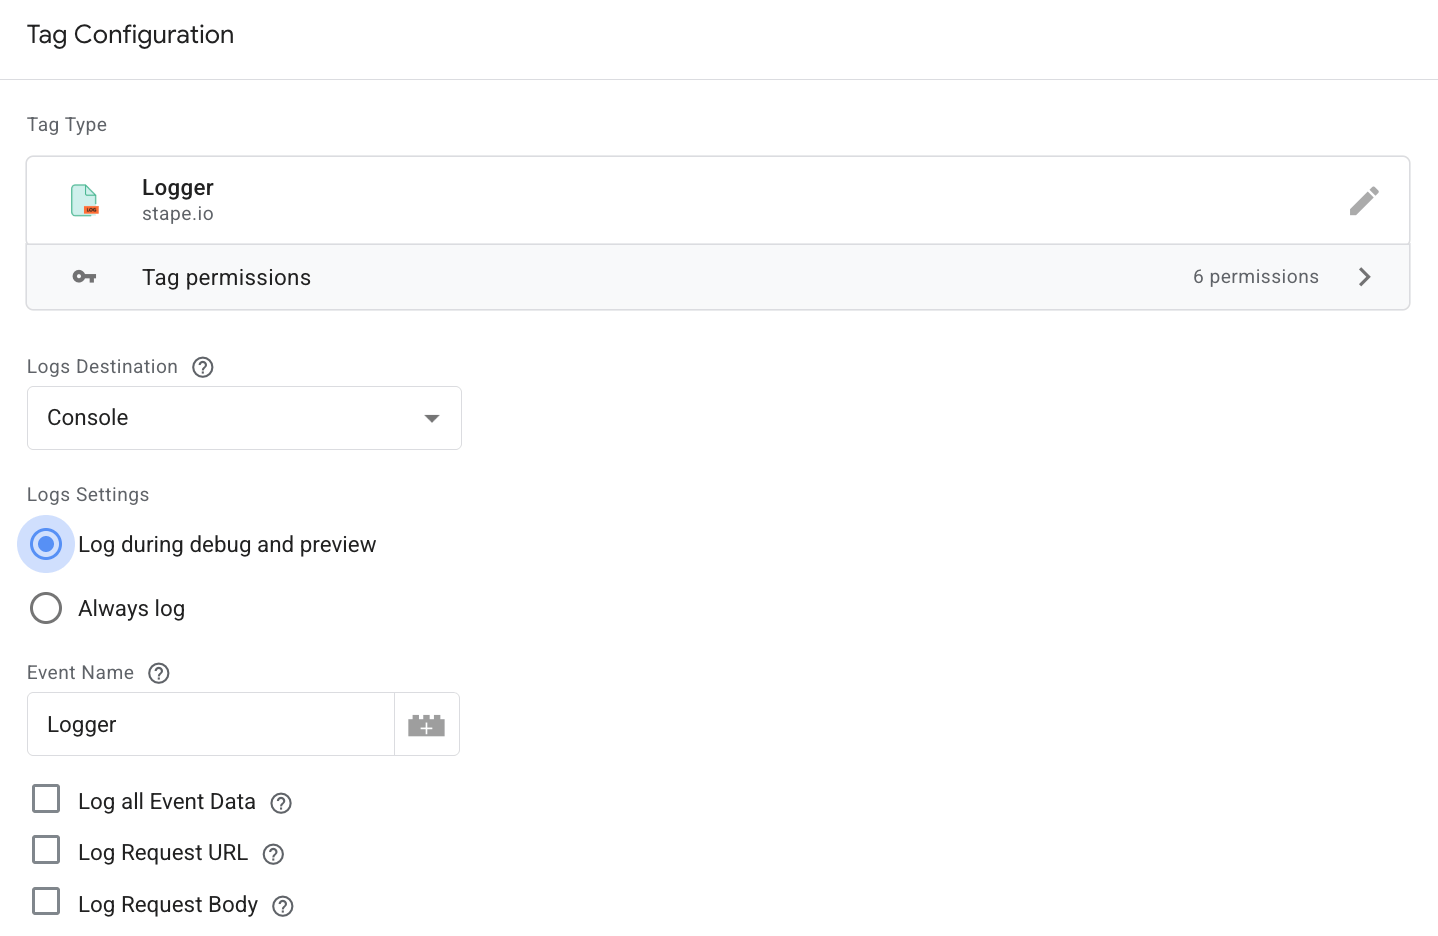
Console as Logs Destination
Select if you want to log events only while debugging or always → select what information you want to add to logs → add event name. You can use either static or dynamic name → add custom data if needed → add a trigger.
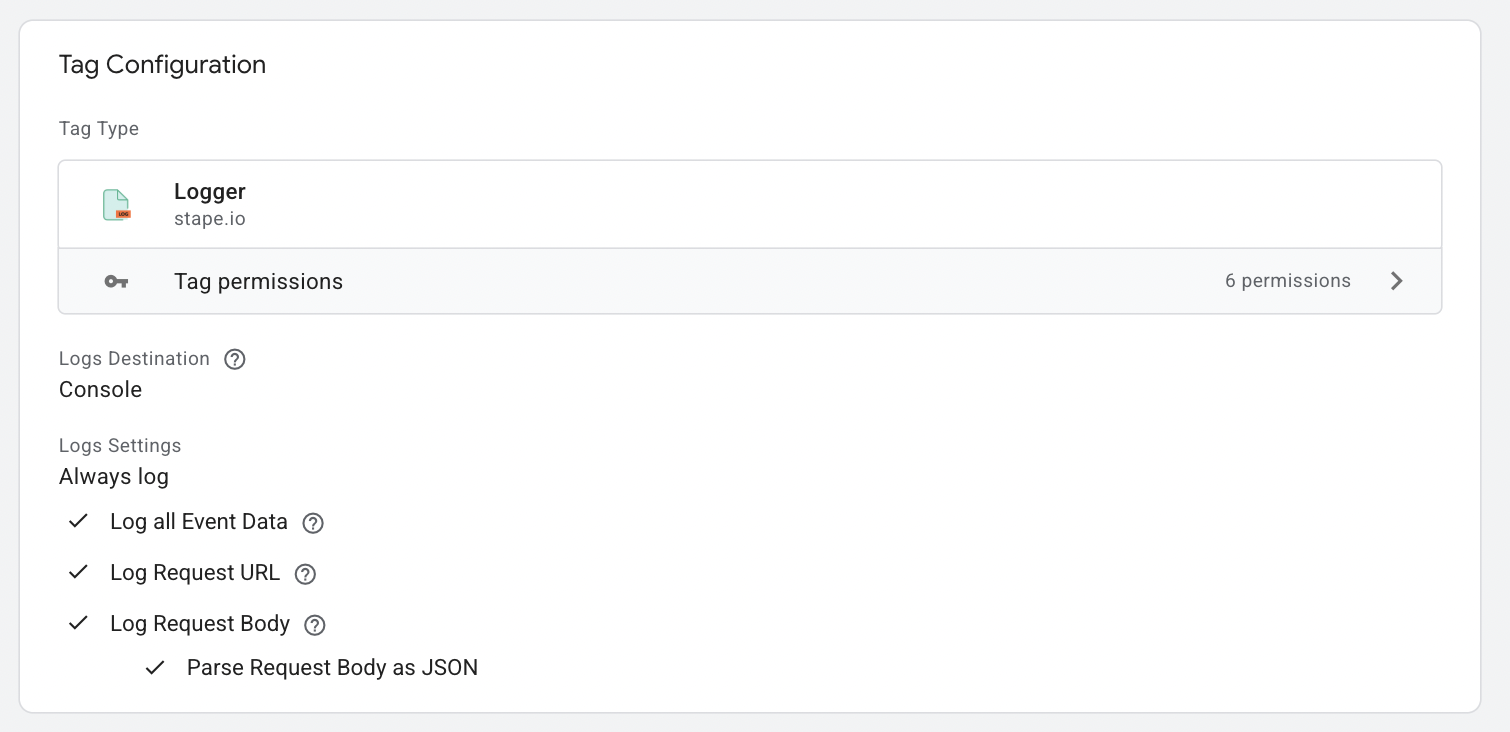
You will see information about requests and can troubleshoot any issues.
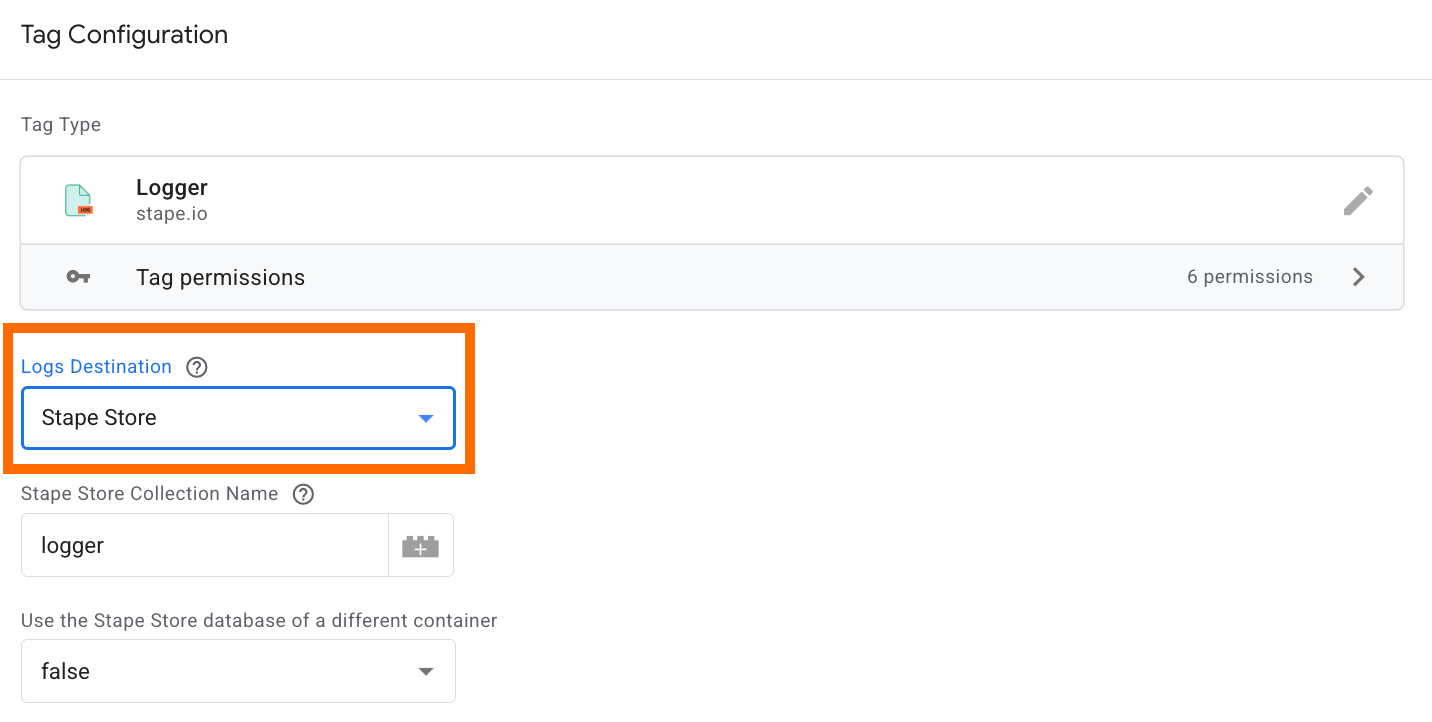
Stape Store as Logs Destination
If you are a Stape Pro or higher plan user and need to save some storage space in the container, opt for Stape Store as the logs destination.
Set up BigQuery logging for Stape's GTM templates
Similarly to the Logs Settings mentioned in the Types of server GTM logs section above, some Stape's GTM templates also support logging the same information to BigQuery.
The following tags already support this feature:
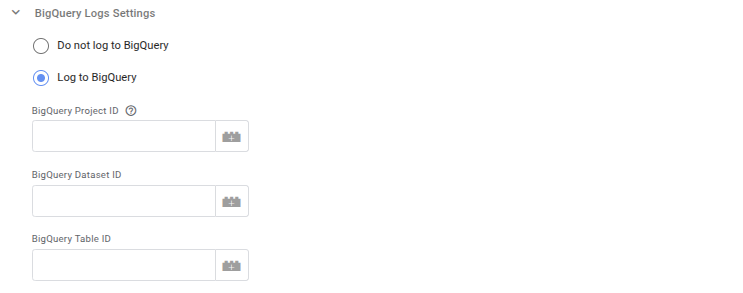
To enable this type of log, go to server GTM → Open the tag/variable → Scroll down to BigQuery Logs Settings, and select Log to BigQuery.
Add the BigQuery Dataset ID and BigQuery Table ID. The field is BigQuery Project ID is optional. If omitted, it will be retrieved from the environment variable GOOGLE_CLOUD_PROJECT where the server container is running. If the server container is running on Google Cloud, GOOGLE_CLOUD_PROJECT will already be set to the Google Cloud Project's ID.
Save the changes.
Remember to use Stape's Service Account power-up; or give the server GTM default service account access to the BigQuery project on GCP.
Now, go to BigQuery and create a table with the following schema:
| Field Name | Type | Mode | Description |
| timestamp | INTEGER | REQUIRED | Unix epoch timestamp (milliseconds). |
| type | STRING | REQUIRED | Log type: Request, Response or Message. |
| trace_id | STRING | REQUIRED | Unique identifier for the request (from the trace-id header). |
| tag_name | STRING | REQUIRED | Name of the GTM tag generating the log. |
| request_method | STRING | NULLABLE | HTTP method (GET, POST, etc.) (if applicable). |
| request_url | STRING | NULLABLE | URL of the API request (if applicable). |
| request_body | JSON | NULLABLE | JSON string representation of request body (if applicable). |
| response_status_code | INTEGER | NULLABLE | HTTP status code from API response (if applicable). |
| response_body | JSON | NULLABLE | JSON string representation of API response body (if applicable). |
| response_headers | JSON | NULLABLE | JSON string representation of API response headers (if applicable). |
| event_name | STRING | NULLABLE | Name of the event being tracked. |
| message | STRING | NULLABLE | Additional log messages (for Message type). |
| reason | STRING | NULLABLE | Reason for failure (for Message type). |
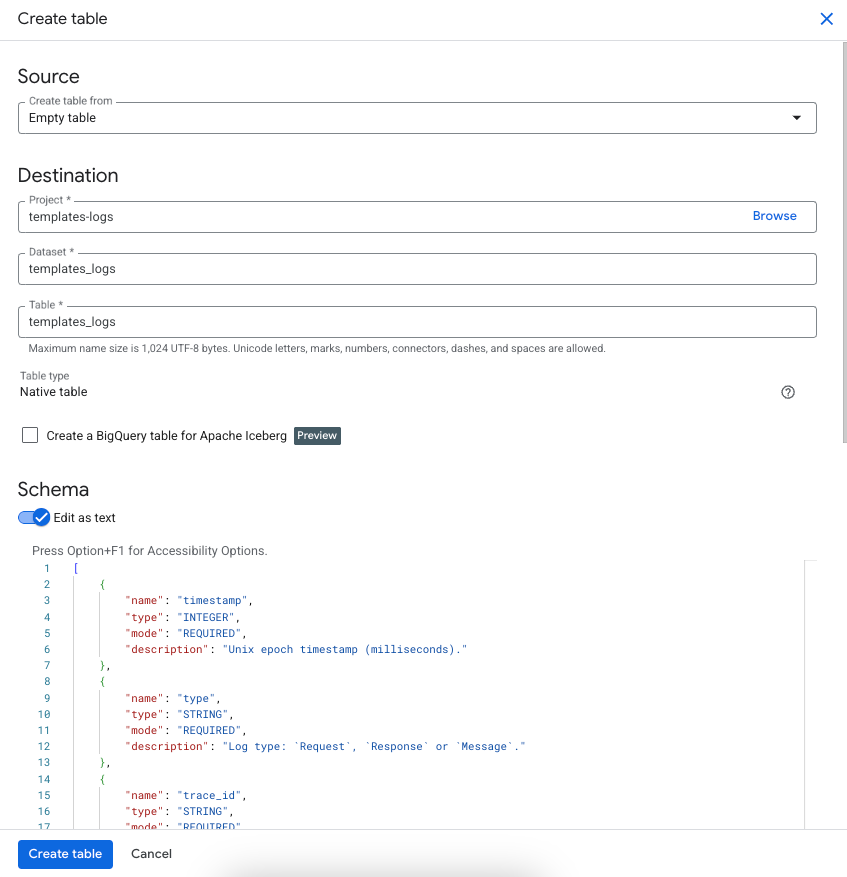
To create a table, go to BigQuery project; choose or Create a dataset; for the chosen dataset, click the three vertical dots next to its name and select Create table.
Give the table a name and click Edit as text under the Schema section.
Copy and paste the table schema below:
[

    {

        "name": "timestamp",

        "type": "INTEGER",

        "mode": "REQUIRED",

        "description": "Unix epoch timestamp (milliseconds)."

    },

    {

        "name": "type",

        "type": "STRING",

        "mode": "REQUIRED",

        "description": "Log type: `Request`, `Response` or `Message`."

    },

    {

        "name": "trace_id",

        "type": "STRING",

        "mode": "REQUIRED",

        "description": "Unique identifier for the request (from the `trace-id` header)."

    },

    {

        "name": "tag_name",

        "type": "STRING",

        "mode": "REQUIRED",

        "description": "Name of the GTM tag generating the log."

    },

    {

        "name": "request_method",

        "type": "STRING",

        "mode": "NULLABLE",

        "description": "HTTP method (GET, POST, etc.)."

    },

    {

        "name": "request_url",

        "type": "STRING",

        "mode": "NULLABLE",

        "description": "URL of the API request."

    },

    {

        "name": "request_body",

        "type": "JSON",

        "mode": "NULLABLE",

        "description": "JSON string representation of request body."

    },

    {

        "name": "response_status_code",

        "type": "INTEGER",

        "mode": "NULLABLE",

        "description": "HTTP status code from API response."

    },

    {

        "name": "response_body",

        "type": "JSON",

        "mode": "NULLABLE",

        "description": "JSON string representation of API response body."

    },

    {

        "name": "response_headers",

        "type": "JSON",

        "mode": "NULLABLE",

        "description": "JSON string representation of API response headers."

    },

    {

        "name": "event_name",

        "type": "STRING",

        "mode": "NULLABLE",

        "description": "Name of the event being tracked."

    },

    {

        "name": "message",

        "type": "STRING",

        "mode": "NULLABLE",

        "description": "Additional log messages (for `Message` type)."

    },

    {

        "name": "reason",

        "type": "STRING",

        "mode": "NULLABLE",

        "description": "Reason for failure (for `Message` type)."

    }

]
As a result, you will get such a table configuration:
You can define the “partitioning setting” and “clustering setting”. It's not required, but this can help optimize performance and costs associated with this table.
Suggestion: partition by ingestion time - day and cluster by tag_name or type.
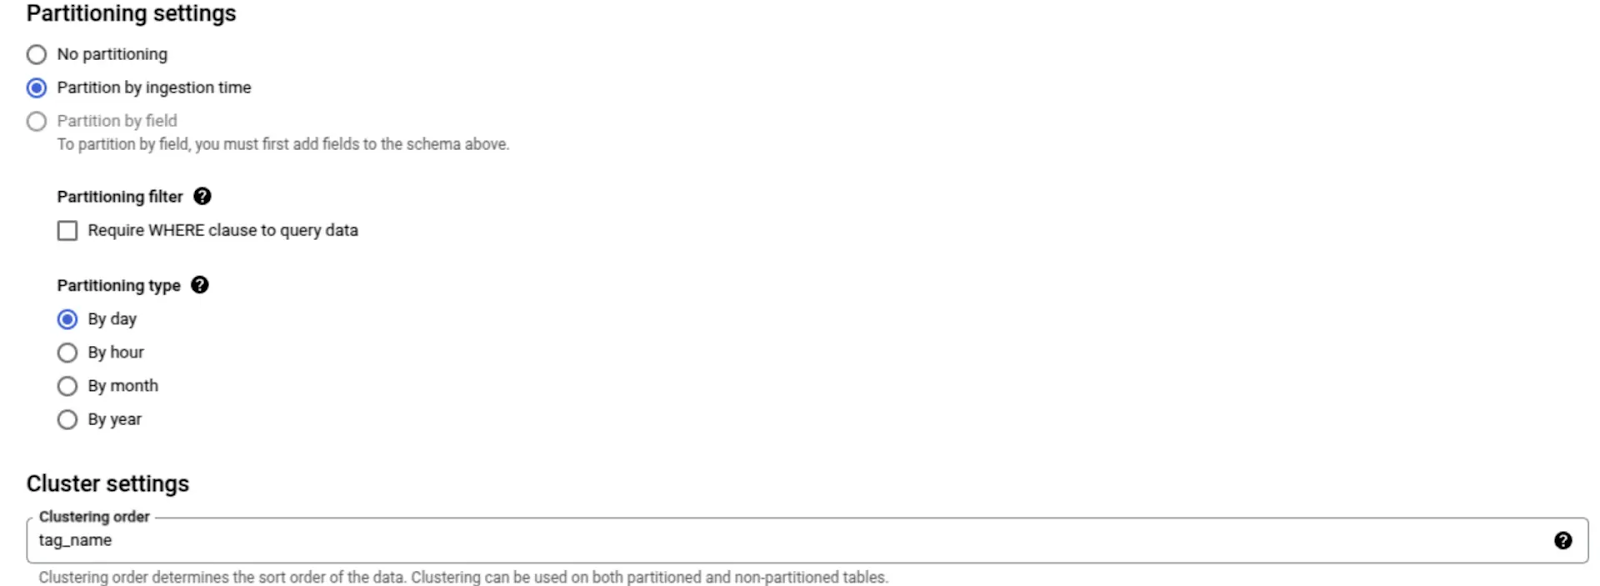
Once all this is done, click Create a table.
Your logs should start to populate in the newly created table.
Conclusion
Server GTM Logs is a powerful tool when setting up, testing, and debugging server-side tagging. The best thing about Stape logs is that they're free for paid plan users. Unlike Google Cloud, where you need to pay an additional charge for logs.
If you use Stape's tags, you can also check response logs and clearly understand whether the platform successfully received and processed requests or encountered some errors.
If you want to test a specific situation, the Logger tag for sGTM can be helpful.
Need help with setting up server-side tagging?
All it takes is a few simple questions. Click Get A Quote, fill-up the form, and we will send you a quote.

Comments