How Google Tag Manager's preview mode helps you check and debug tags
Maryna Semidubarska
AuthorGoogle Tag Manager (GTM) can make tracking easy when everything works as expected. But sometimes tags do not fire, or data disappears for no clear reason. That is when Google Tag Manager's preview and debug mode help. It shows exactly what happens inside your GTM setup, so you can find and fix issues before they affect your reports. Here is how it works and how to use it to keep your tracking accurate.
| Get Stape GTM Helper to bring order to client containers packed with tags and debug faster. Simplify preview mode into a clear, structured view of tags, requests, and consent data. |
What is a Google Tag Manager preview and debug mode?
Google Tag Manager's preview and debug mode is a testing option that helps you check tags before they go live. When you turn it on, GTM opens your website with a debug panel showing what happens in real time. You can see which tags fired, which did not, what data was sent, and if any errors appeared. All of this happens without changing what real visitors see.
Preview Mode gives you a full look at how your tracking works, step by step. It helps you find issues before they reach your reports, like wrong triggers or missing variables. Always test in Preview Mode before publishing. This way, you can confirm that every tag, trigger, and variable works as planned.
With Preview Mode, you can see:
- Which tags fire after specific user actions.
- Which tags do not fire, and why.
- What data do your variables hold at each step.
- How the data layer updates after every event.
How to enable Google Tag Manager preview mode
To enable Google Tag Manager's preview and debug mode, follow these steps:
1. Go to tagmanager.google.com and log into your Google Account.
2. Open the container you want to test.
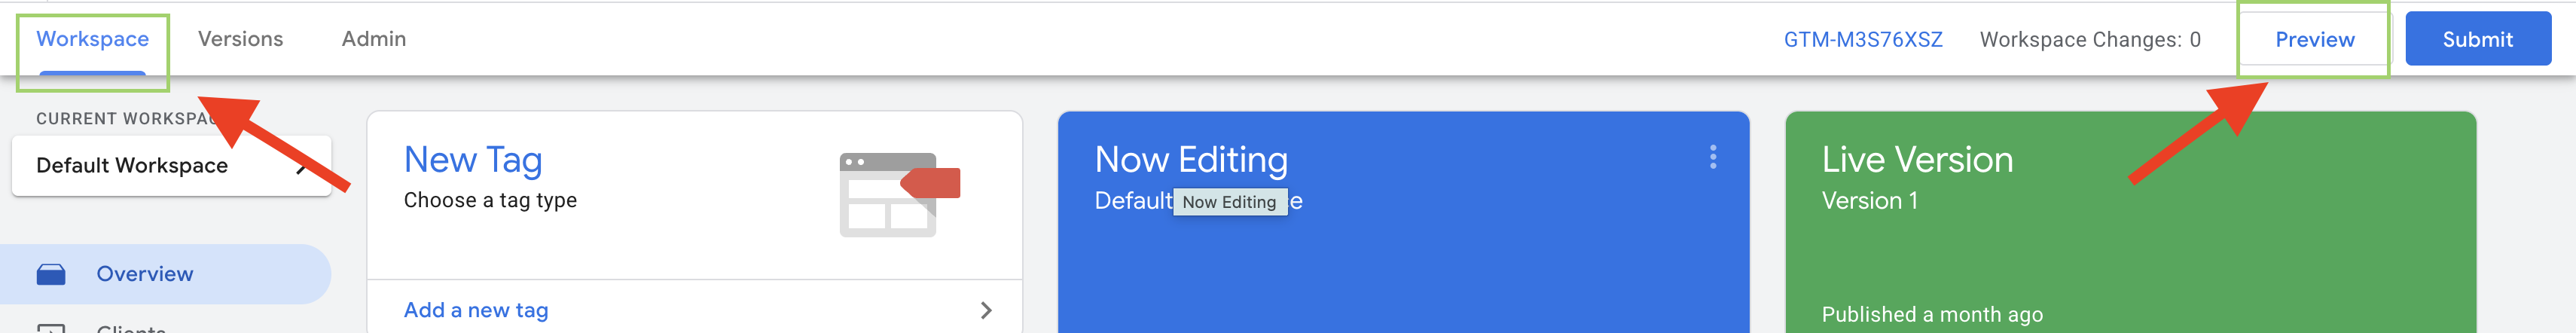
3. In the Workspace view, click Preview in the top-right corner to launch Google Tag Assistant.
4. Type your website URL in the field and click Connect.
5. If your site doesn't load correctly, uncheck the box Include debug signal in the URL before connecting.
6. Your website will open in a new tab or window with the preview badge at the bottom right.
7. Click Continue to access the full debug panel.
Tip: installing the Tag Assistant Companion Chrome extension helps the preview open smoothly and reduces connection issues. You can also start a session from the Tag Assistant activation page.
Basics of GTM preview mode
When you open Google Tag Manager's preview and debug mode, you will see the Tag Assistant panel with different sections that help you check how your tracking works. Each part shows what happens when someone visits your site, so you can watch how your tags, triggers, and variables behave in real time and fix problems easily.
1. Event timeline.
Shows all events in the order they happen, such as Consent Initialization, Container Loaded, DOM Ready, or custom events like form submission or purchase. Click an event to see what data was sent to the data layer at that time.
2. Tags tab.
Shows which tags fired and which did not for the selected event. Tags that fired appear under Tags Fired, and those that did not appear under Tags Not Fired with reasons. Click a tag to see its triggers and learn why it fired or failed.
3. Variables tab.
Lists the variable values for each event. Check that your variables collect the right data, like the Click URL or Form ID. If a variable is undefined, it may be set up wrong or missing data.
4. Data layer tab.
Displays the data layer object for each event. It helps you check if custom events or eCommerce data were pushed correctly. If you find useful data that is not yet tracked, write it down so you can create a variable later.
5. Consent tab.
If you use Google Consent Mode, this tab shows the consent state for each type, such as ad_storage or analytics_storage. Use it to see if a tag did not fire because consent was not given.
6. Errors tab.
Shows any JavaScript errors or tag problems. Use it to find issues like syntax errors in custom HTML or failed templates.
7. Header section.
Shows your container ID, website domain, and connection status. If your container ID does not appear, GTM is not installed correctly. You can also switch between container versions or environments if needed.
How to use Google Tag Manager preview mode
When Google Tag Manager's preview and debug mode is open, you can test your setup by acting like a real user and checking how your tags respond. Here is how to use it step by step.
1. Simulate real user actions.
Move around your site as a visitor would. Click buttons, submit forms, add products to the cart, make a test purchase, or play a video. Each action creates an event in the debug panel, such as click, form submit, or purchase.
2. Check trigger conditions.
After each action, open the Tags tab for that event. Check if the right tag fired, and make sure it did not fire more than it should. If it did not fire, look under Tags Not Fired to see why. For example, a trigger might use a URL that contains “thank-you,” but your test page URL may not match.
3. Confirm variable values.
Go to the Variables tab to see what values your variables captured. For example, check if Click Text or Click URL collected the right data. If a variable shows undefined or a wrong value, fix its setup in GTM or check that the data appears in the data layer at the right time.
4. Test different cases.
Try more than one path. Submit a form with success and another with an error, or test purchases of different product types. The panel updates live, so you can keep clicking and see all events appear in the event list.
5. Refresh after changes.
If you adjust something in GTM, you must refresh the preview session to load the new draft. Click Preview again to reconnect, then repeat your test to confirm that the issue is fixed.
6. Watch for errors.
Keep an eye on the Errors tab in the debug panel. If a tag fails, you might see messages about broken JavaScript or missing elements. Fix these one by one and retest until all tags work correctly.
Debugging isn't just about triggers; it's about understanding the code being fired. If GTM shows a tag as 'Fired' but no data reaches your platform, you might be dealing with a crashed ad tag. We’ve mapped out the most common advertising tags errors to help you troubleshoot these technical slip-ups in real-time.
Stape's GTM extension for a better GTM debug mode experience
Google Tag Manager's preview and debug mode is efficient, but if your container has many tags, it can still feel hard to read. Stape GTM Helper is a free Chrome extension that makes debugging clearer and faster, especially when using server Google Tag Manager. It adds extra tools to make the panel easier to read and use.
Main benefits of using Stape GTM Helper:
1. Focused tag testing.
You can filter the tags you want to test and hide the rest. This helps a lot when working with containers full of tags. It keeps your view clean and lets you focus on what you are debugging.
2. Clear tag status visibility.
The extension uses colors to show which tags fired and which failed. Tags that work appear in green, and those that failed appear in red. You do not need to scroll through text to find issues, as you see them right away.
3. Readable request details.
If you send complex data, like GA4 event payloads or JSON requests, the extension formats it into a clear and readable layout. You can easily check event parameters or requests from your server container without confusion.
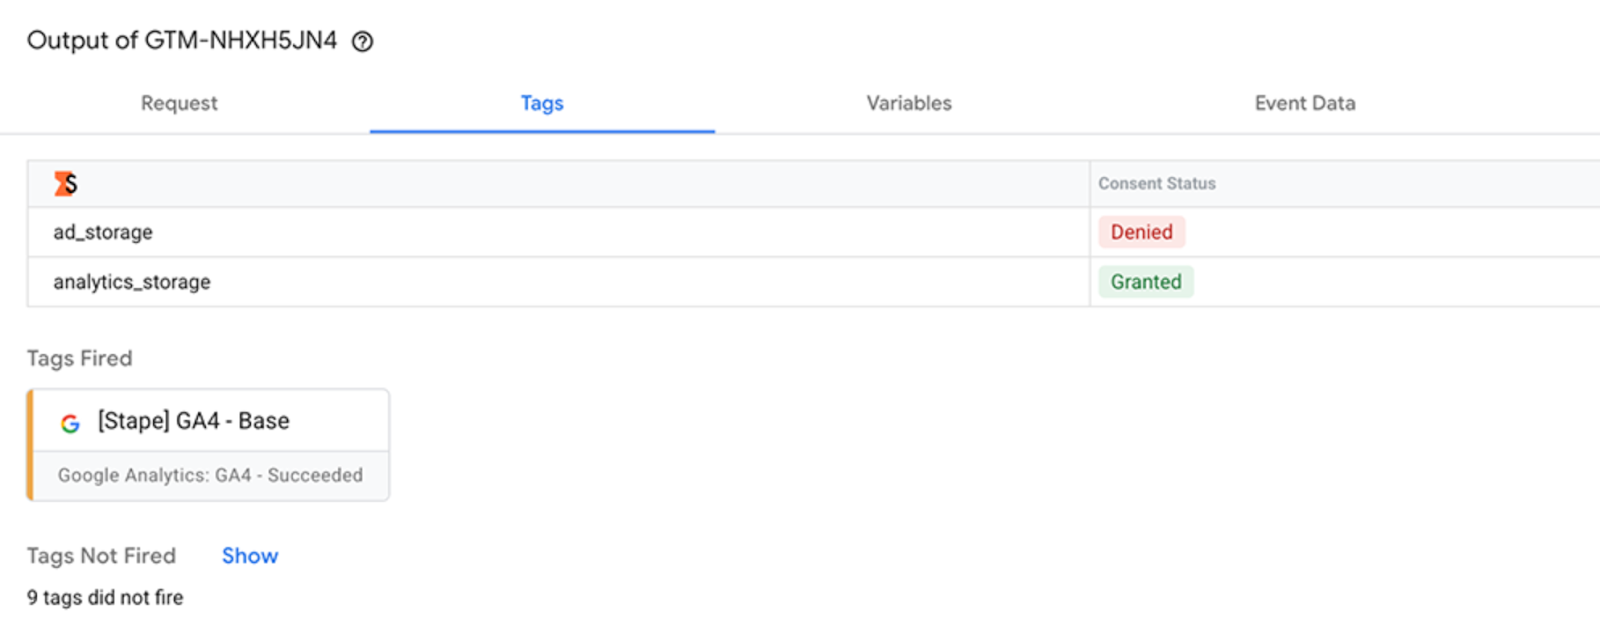
4. Visible consent status.
In a server container preview, checking consent usually means digging into request details. The Stape GTM Helper makes it easier by reading the gcs parameter from GA4 requests and showing consent types like ad_storage and analytics_storage directly in the panel. You can instantly see if a tag didn't fire because consent was denied.
To use Stape GTM Helper, install it from the Chrome Web Store. Then open Google Tag Manager's preview and debug mode as usual, and you will see the new interface with its added options.
More consistent event tracking and data accuracy can significantly increase reported conversions, as it happened for Atasun Optik, which achieved 93% more conversions after moving tracking to the server GTM on Stape with Custom Loader and Cookie Keeper enabled.
| For complex setups, explore solutions that help make your GTM setup for both web and server containers more profound, including power-ups, and templates. |
Best practices for debugging in GTM
GTM preview and debug mode is not only helpful for fixing broken tags, but also for building a good habit of testing and verifying your setup regularly. These simple habits help make sure your tags fire correctly and your data reaches the right tools.
Use clear names.
Give your tags, triggers, and variables simple and descriptive names. For example, GA4 event – form submit is much easier to understand than Event tag 1. Appropriate naming helps you see what each tag is supposed to do and notice right away when something goes wrong.
Check the Errors tab.
When tags don't fire as expected, open the Errors tab in the preview panel. It often shows JavaScript issues or missing templates that can be hard to see elsewhere.
Test in Incognito mode.
Browser extensions or cache can block tags. Use an Incognito window without extensions to test in a clean environment. Just remember to log into GTM again before starting the preview.
Keep notes and versions.
Write down what you changed and what you tested. When publishing, use clear version names and notes inside GTM. If something breaks later, you can quickly trace back the cause.
For even smoother debugging, explore useful GTM extensions and power-ups that can help you monitor container versions, validate tags faster, and maintain accuracy across projects.
Refresh/share/exit preview mode
| GTM preview and debug mode works best when you use it actively and not just once. It shows what happens when people click or scroll and helps you fix problems right away. |
Refreshing preview mode.
After adding a tag or changing a trigger, your current preview will not show those updates until you refresh it. Go back to your container in GTM and click Preview again. It will reconnect to your site and load the latest draft. Then, repeat your test actions to confirm the fix. Always refresh after every change, or you will still see old results.
Sharing preview mode.
If you want someone else to see the same debug view, open the Tag Assistant tab, click the three dots in the top-right corner, and choose Share. You will get a link to send to your colleague. They can open it and see your events, tags, and data layer without needing direct access to your GTM account.
Just make sure they can reach your site if it requires a login or has a firewall. The shared link stops working once you publish a new version or end the session.
Exiting preview mode.
When you finish testing, click Finish on the preview badge shown on your website. This closes the connection and removes the badge. You can also close the Tag Assistant tab and confirm to end the session. If the badge stays visible, go to tagassistant.google.com and end the session manually, or clear your browser cookies.
Leaving preview mode active affects only your browser, not other visitors. Still, it is good practice to close it after testing to avoid confusion. Once done, your site returns to normal, and you can publish your container knowing it was tested properly.
What to do if the GTM preview mode is not working?
Sometimes you click Preview and nothing happens. The debug panel does not connect, or your site never loads with the badge. To fix that, start by reviewing why GTM preview mode might not connect to see common causes. Then go through the fixes below in order.
1. Check your GTM installation.
Make sure your Google Tag Manager installation code is executed properly on your website. It should have one part right after the opening <head> tag and another right after the opening <body> tag, both using the correct container ID (for example, GTM-XXXXXX). To confirm it works, open your browser's Developer Tools, go to the Network tab, and check for a request to gtm.js when the page loads. If you don't see it or it shows an error, GTM is not loading properly, and the preview will not connect.
2. Allow third-party cookies.
The preview uses cookies to connect your website and Tag Assistant. If your browser blocks third-party cookies, the connection will fail. In Chrome, add an exception for tagassistant.google.com and your site domain. In Safari, turn off Prevent cross-site tracking while testing. Then try previewing again.
3. Turn off pop-up blockers.
GTM opens new tabs when you start preview. If pop-ups are blocked, the window will not open. Allow pop-ups for Google Tag Manager or click Allow in your browser when asked.
4. Disable ad blockers and privacy extensions.
Tools like AdBlock, Ghostery, or Privacy Badger can block the Tag Assistant script. Disable them or open an Incognito window with extensions off, then retry the preview.
5. Use the same browser window.
Stay in the same browser and profile where you started the preview. If you open your site in a different browser or Chrome profile, the preview cannot connect because the debug cookie is missing.
6. Check for other issues.
Preview might not work on HTTP pages or sites with a strict Content Security Policy that blocks Tag Assistant scripts. Also, some browsers, like Brave, block GTM by default. For testing, use Chrome or Firefox and turn off any settings that block scripts.
| If none of these fixes help, you can always get help from experts from Stape Care. They can review your setup, find what blocks the preview connection, and guide you through the right fix. |
How to validate GTM tracking after debugging
After fixing issues in GTM preview and debug mode, you need to confirm that your tags are not only firing but also sending data to the right platforms. Use Tracking Checker by Stape to analyze the tracking health of your website and see if your setup sends complete and consistent signals. Then follow the checks below to confirm everything step by step.
Check Google Analytics Real-time or DebugView.
Do your test actions again and open GA4 DebugView or Real-time reports. Make sure page views, events, or conversions appear with the correct values. For example, if you test a purchase event, confirm it shows up in GA4 with the right amount and item details.
Verify with Tag Assistant.
Turn off Preview Mode, open the Tag Assistant Chrome extension, and go through the same actions on your site. The tool records which Google tags fired and shows if any failed or duplicated. It is useful for double-checking Google Ads and Analytics tags.
Look at network requests.
If you want to double-check, open Developer Tools → Network tab in your browser. Perform your test again and search for requests like collect (for Google Analytics) or gtm.js. If they appear with a 200 OK status, your tag sent the data successfully.
Use platform testing tools.
Each platform has its own way to confirm tracking. Use Meta Events Manager's Test Events, Google Ads conversion diagnostics, or LinkedIn Insight Tag tester to check that events are received. If your tag fired in GTM but nothing appears in the platform, check IDs or event parameters.
Do a live test.
Once your setup looks correct, do a test on your live site after publishing changes. Try submitting a form or making a small test purchase, then check the data in your reports the next day. Watch for missing conversions or unexpected spikes in event counts.
5 Most common issues and solutions in GTM preview mode
Even if you know GTM well, its preview and debug mode can still act in unexpected ways. Here are the five problems marketers face most often, and how to fix each one.
1. Preview mode does not connect.
You click Preview, but the panel stays on Connecting. This usually happens when third-party cookies are blocked, pop-ups are stopped, or the GTM code is not installed correctly.
Fix: allow cookies for tagassistant.google.com, enable pop-ups, and check that your site loads gtm.js in the browser's Network tab. If you use an ad blocker, disable it or test in Incognito mode. Then try again.
2. A tag is not firing.
You expect a tag to fire, but it does not appear under Tags Fired.
Fix: click the matching event in the left timeline, then look under Tags Not Fired to see why. You will see which trigger conditions failed (for example, "Page Path contains /thank-you = false"). Adjust the trigger, refresh the preview, and test again.
Another possible problem may be that the tag is not firing at first touch due to a conflict with your consent banner configuration.
3. A tag fires more than once.
Sometimes a tag appears multiple times for a single action, like two page views or duplicate events.
Fix: check the event timeline to see if your site pushed more than one event or if the tag has multiple triggers. Use trigger filters or blocking triggers to control when it fires. After changes, refresh the preview and confirm it fires only once per action.
4. Variables show as undefined.
You expect to see a value in a variable, but it shows as undefined.
Fix: open the Variables tab and check that the variable's name matches the key in the Data Layer (it is case-sensitive). If the value appears later than your trigger, delay the tag by using a DOM Ready or other later event. If the data is missing completely, ask a developer to push it into the data layer.
5. No events or tags appear.
The preview connects, but the panel is empty and shows no activity.
Fix: confirm that the container ID on your site matches the one you are previewing. If your site uses GTM environments, open Admin → Environments → Share Preview for the correct one. Make sure your container is published and installed properly. If it's still blank, revisit the connection or cookie settings.
FAQs:
Why is my tag firing multiple times in GTM preview mode?
If a tag fires more than once, it usually means more than one trigger or event is linked to it. For example, the tag might fire on both a page view and a history change, or your site might send duplicate events.
Open the event timeline in preview and check which events made the tag fire. Then, keep only one trigger that matches your goal or add a blocking trigger to stop duplicates. After adjusting, refresh the preview: the tag should fire only once per action now.
How to troubleshoot Google Tag Manager?
Start by opening the GTM preview and debug mode on the page where the issue happens. Recreate the action and check if the right tag fired.
If it didn't, look under Tags Not Fired to see which trigger failed, then open the Variables tab to confirm that all values are filled in. Check the Errors tab for script issues.
Next, make sure the GTM container is correctly installed and uses the right container ID. If the tag fired but data didn't reach the platform, check settings like your GA4 Measurement ID or ad account ID.
When testing, focus on one change at a time and disable other tags if needed. This helps you see what really causes the issue.
How do I troubleshoot missing tags in GTM?
If a tag you created doesn't show up in Preview Mode, it usually means it never tried to fire. First, check that you saved it and are testing the right container. Then, open the tag and confirm that it's not paused and that its trigger is linked to the correct event.
Try setting the trigger to something broad, like All Pages, to see if the tag fires. If it does, the trigger conditions are too narrow. If it doesn't fire at all, check Tags Not Fired in Preview Mode to see which rule failed.
If the tag isn't listed there, open the Data Layer tab to see what events appear. Your trigger's event name might not match the event pushed to the data layer. Once the tag, trigger, and event name match, refresh the preview and test again.

Comments