Guide to debugging and monitoring server-side tracking configuration
Ivanna Holubovska
AuthorDebugging server-side tracking can be challenging but essential for ensuring precise server-side tracking. The process of debugging server-side tracking includes several key elements.
Firstly, monitoring of the cloud server infrastructure that hosts your server-side Google Tag Manager container. If you are using Stape, our team handles this for you.
The second aspect involves ensuring the accuracy of your tracking setup. Since server-side tracking via sGTM can be implemented in various ways, the tools and methods for debugging and monitoring are also different.
| Instantly verify your website's tracking foundation. Stape's free Website Tracking Checker confirms if your GTM and server-side containers are set up properly. The tool shows you how well your website analytics tracking aligns with modern best practices and highlights opportunities to improve data quality for your analytics systems and ad platforms. Digital marketers and agencies can run fast tracking audits, use the report as a checklist to double-check implementations, and win more clients with proof of server-side tracking value. |
This blog post will discuss several methods for debugging and monitoring the server-side tracking.
Server GTM debugger
The sGTM Debugger helps debug and analyze server Google Tag Manager implementations (understanding how tags, triggers, and variables work within GTM).
One of the standout features of the sGTM Debugger is its user-friendly interface. Even those with limited technical expertise can easily navigate through the data streams. The tool ensures comprehensive coverage of all potential tracking issues, from identifying missing or erroneous data to validating trigger setups. Let’s talk about each component of the sGTM preview.
1. Summary tab
It shows all the details about the requests and events. These requests usually come from the web GTM container and are transported to the server side. However, several ways of delivering server data to the sGTM container exist.
To see the details of each request, simply click on it. The rest of the information should be checked in other tabs.
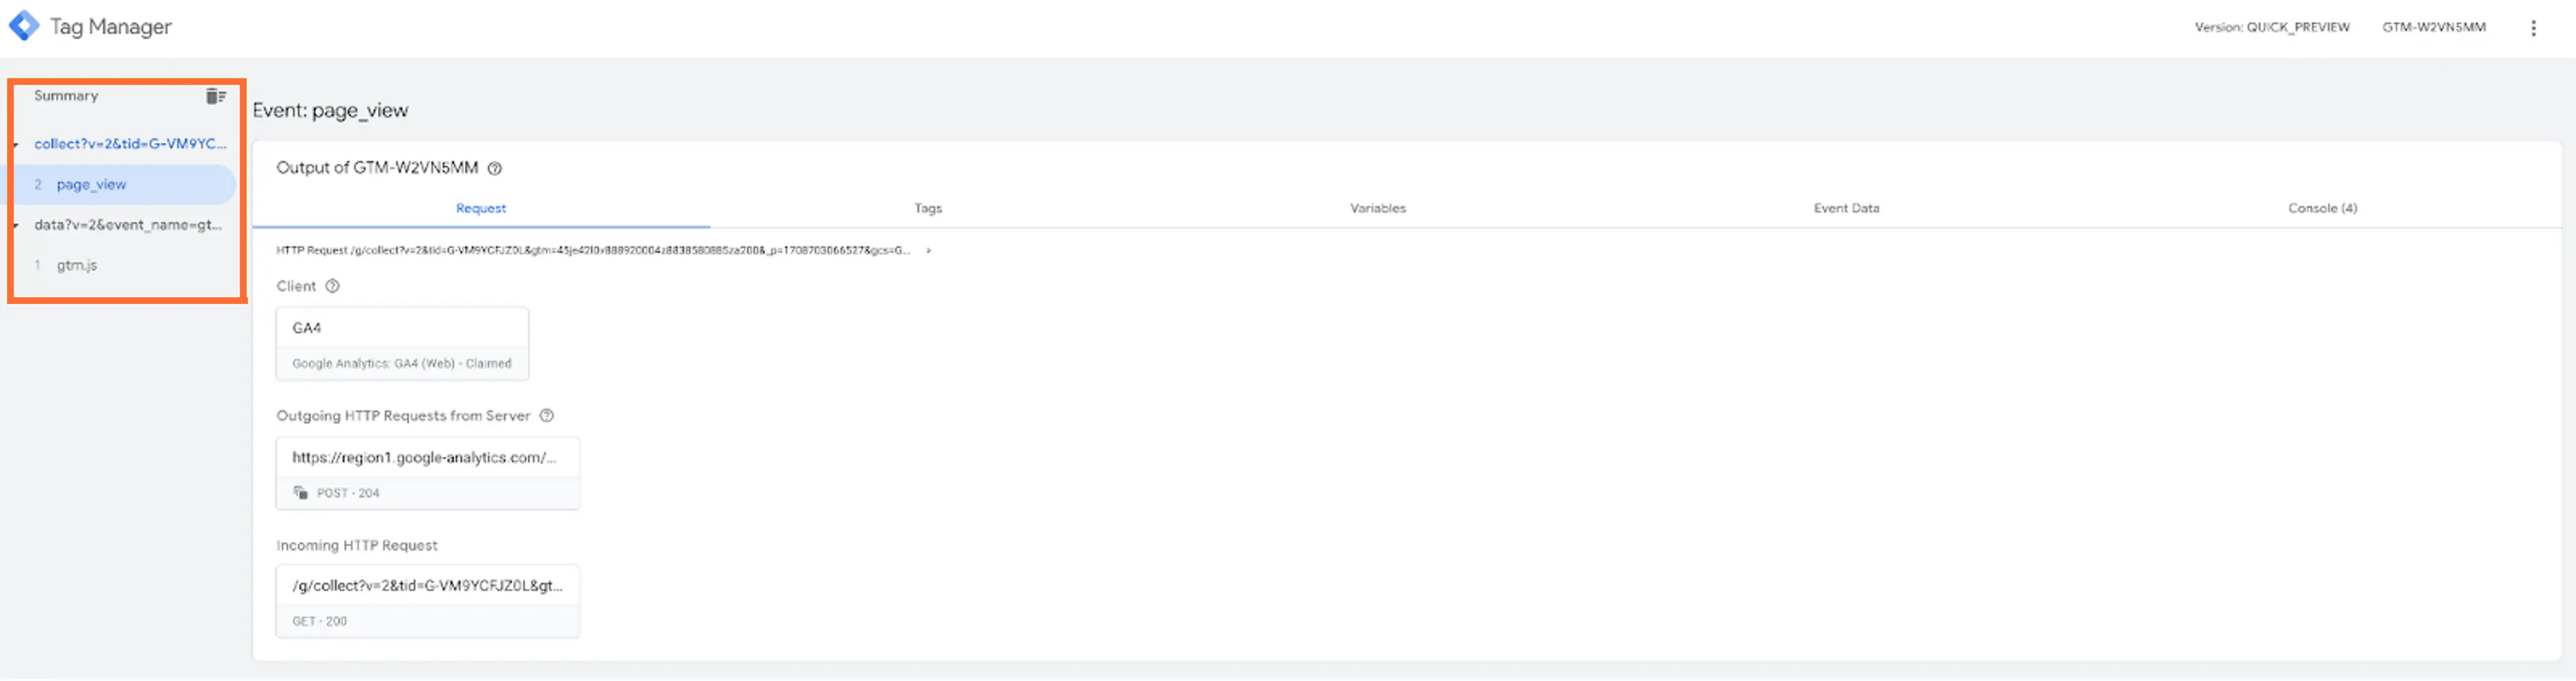
2. Request tab
There are three main components in this tab:
- Client: a client that claimed this request (e.g. GA4).
- Incoming HTTP request: request received by the server Google Tag Manager container. You can click on the incoming request and check its details like Request URL, request header, status code, etc.
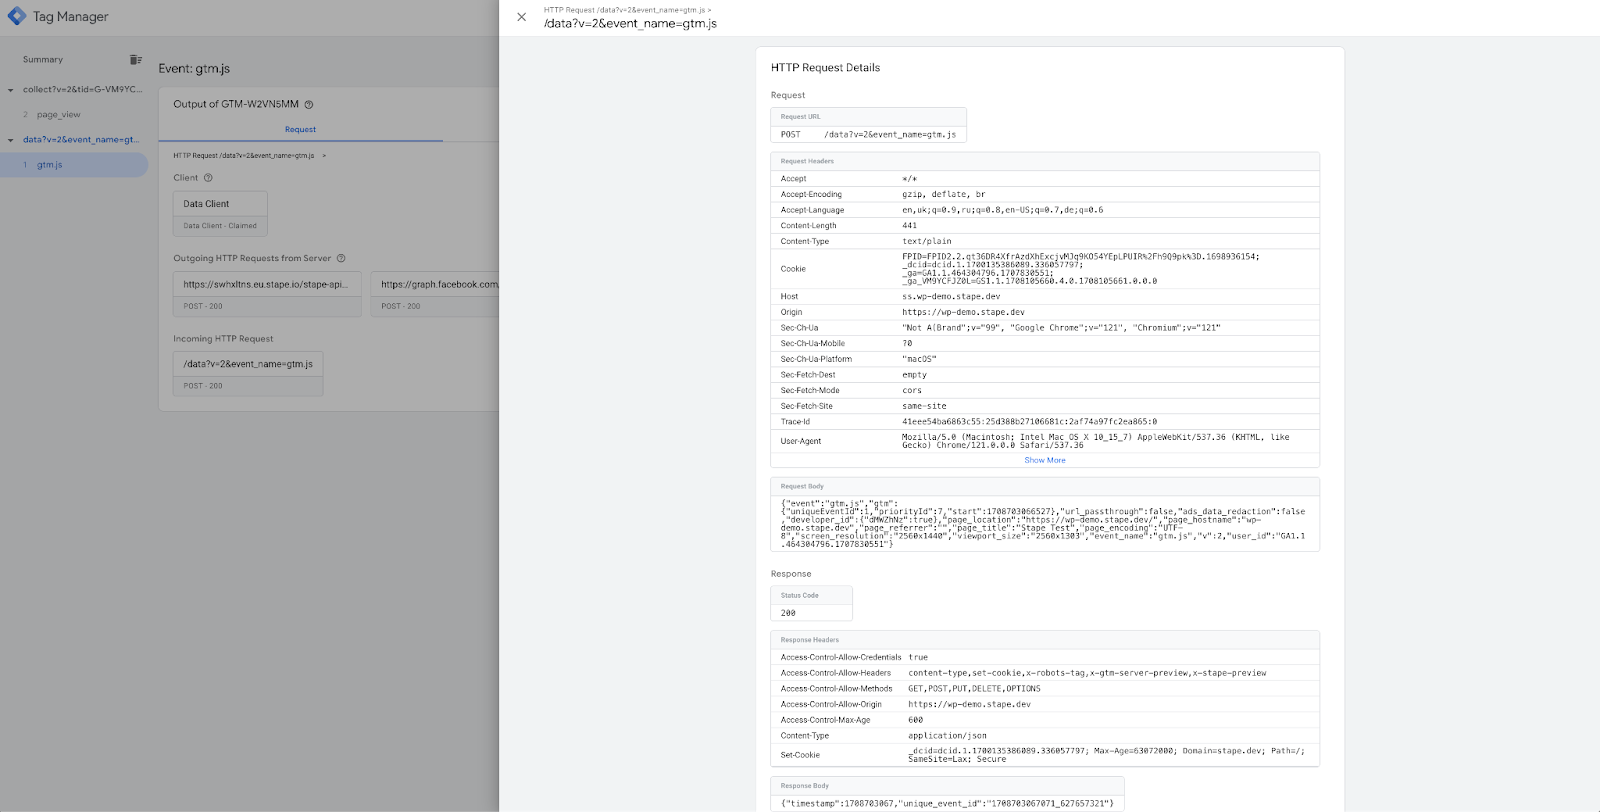
- Outgoing HTTP request: request sent from the server Google Tag Manager to any vendor (for example, Google Analytics, Facebook, TikTok, etc). You might have several outgoing HTTP requests for the exact incoming requests. You can see exactly what data was sent to each vendor by clicking on the outgoing HTTP request.
If the response code for the outgoing request is not 200, meaning there were some issues with processing the request, you can check the response body and read which error exactly stopped the request from processing.
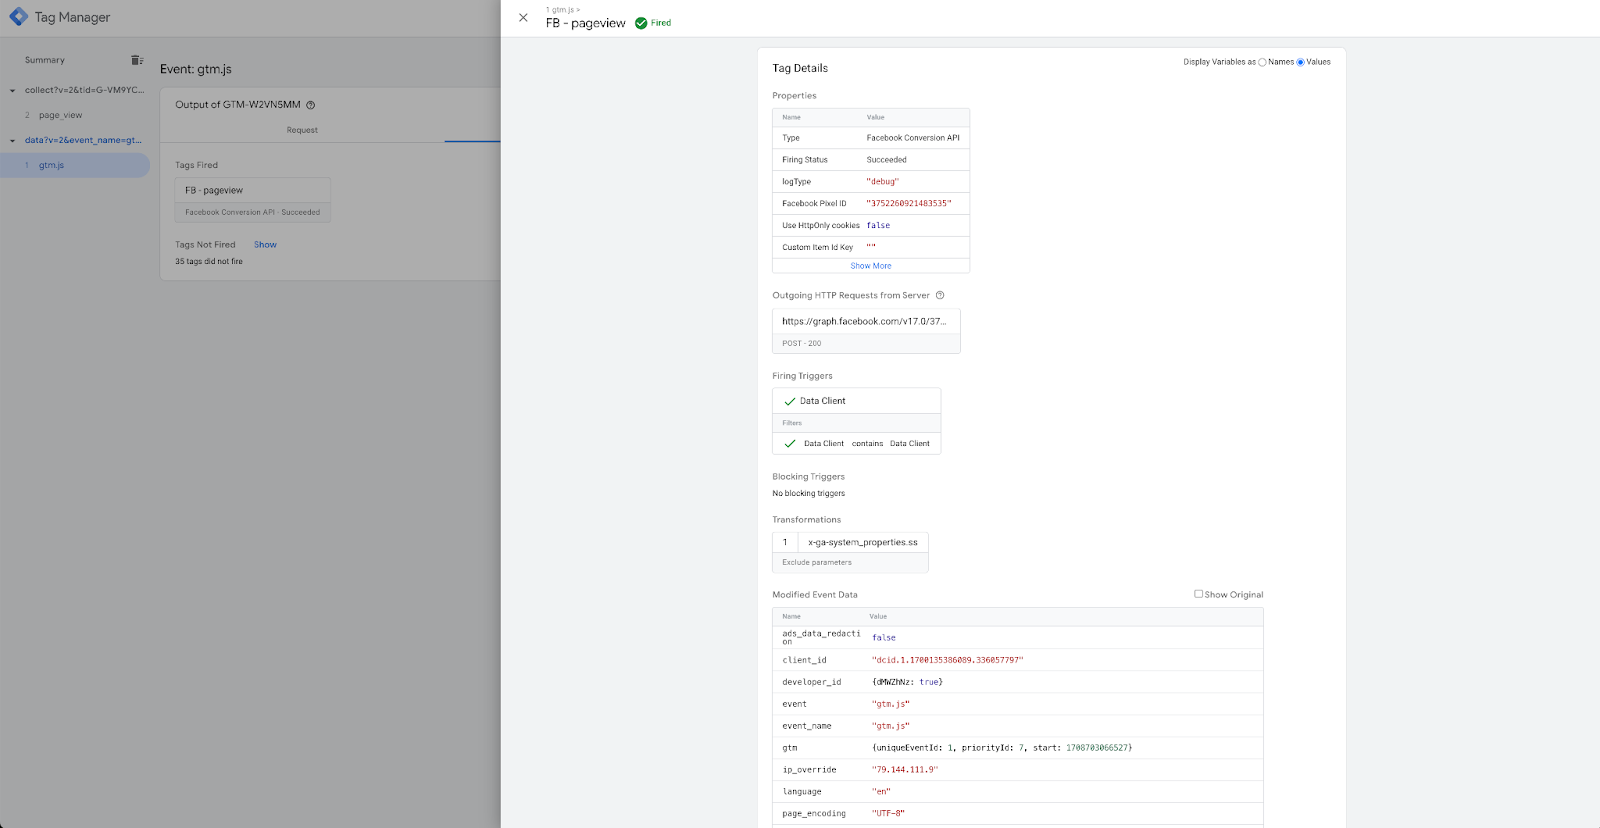
3. Tags tab
Shows all the tags fired for each incoming event request. If you click on the tag, it will show you all the data the tag uses.
4. Variables tab
You can see all the variables you have created and their values for the corresponding event.
5. Event data tab
Whenever the client claims the requests in the sGTM container, it converts request data to event data. Then, you can use event data to configure variables. If we compare it to a web GTM container, event data is like a data layer of an sGTM container.
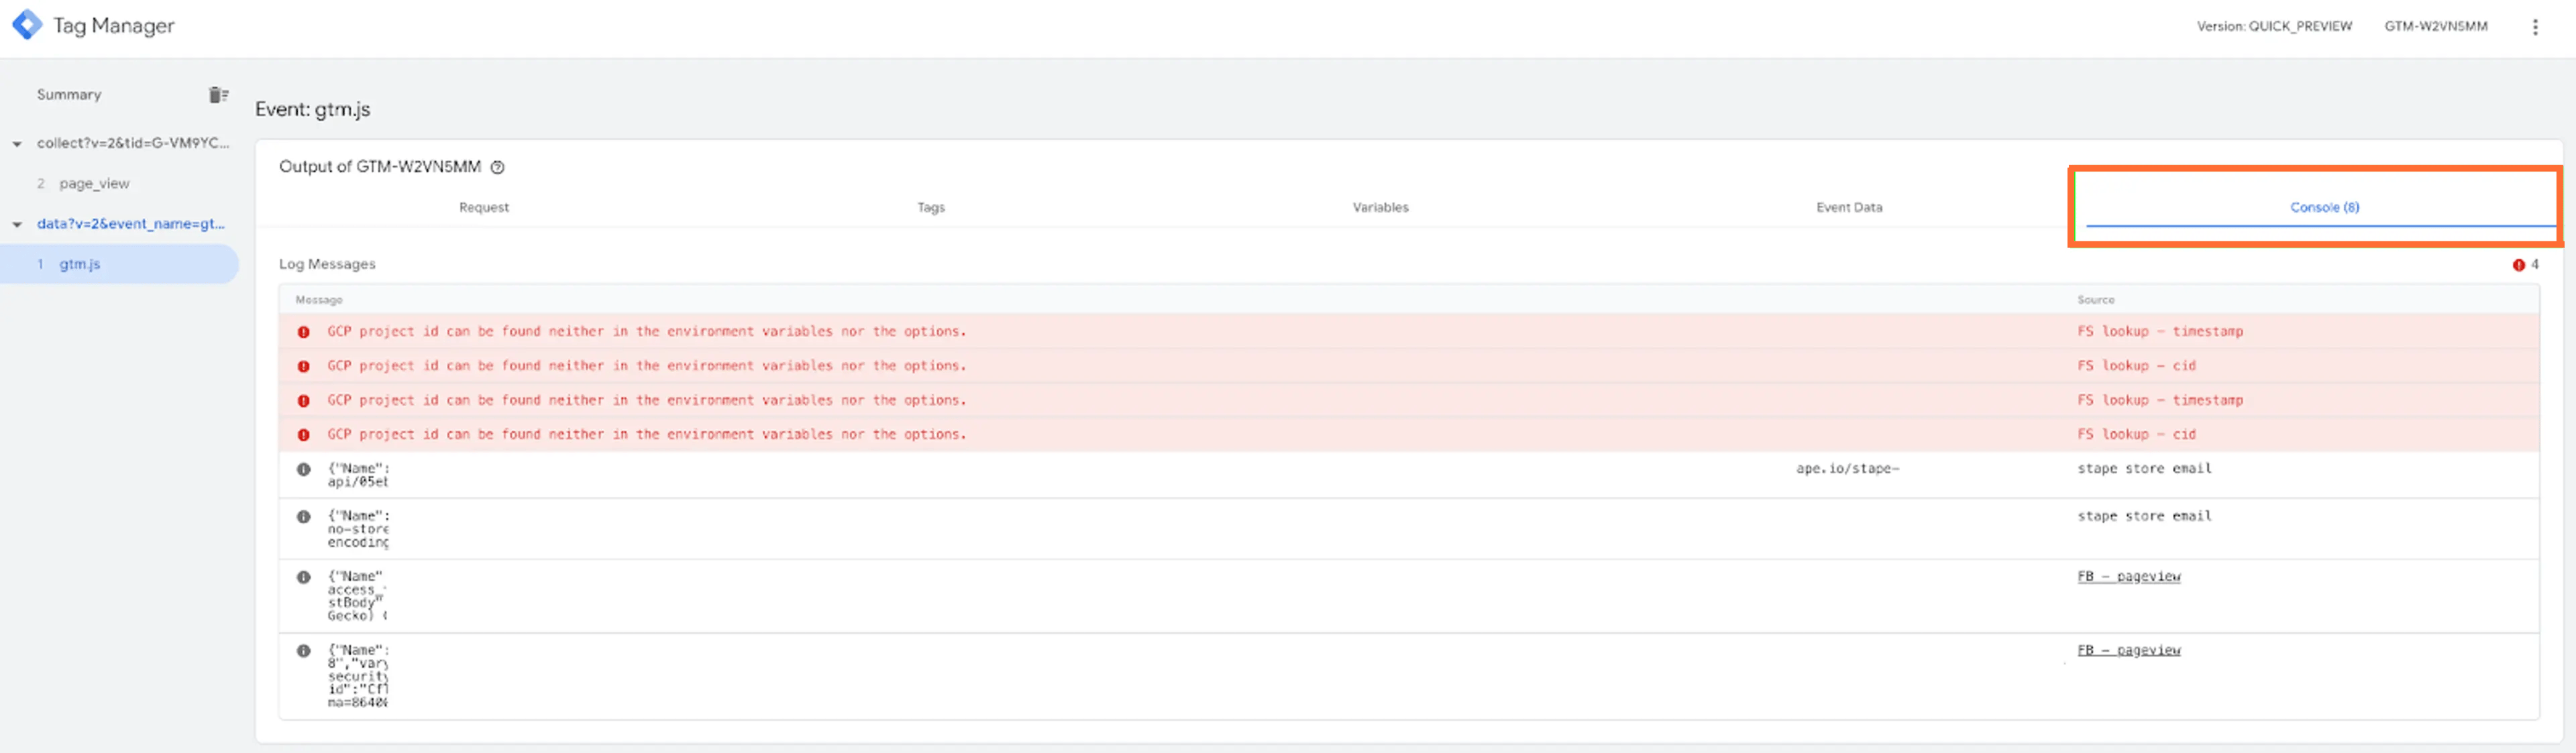
6. Console
Shows all errors that happened in this request (if any). It consists of the error detail and the source that caused the error.
| Use Stape GTM Helper to make tags and server requests more visible in the GTM preview, making monitoring and debugging easier for clients or your own GTM accounts. |
Stape logs
Logs allow you to monitor sent data, response codes, and processed parameters, ensuring no network or vendor issues are missed.
We offer log access to users on Pro and Business plans. Users on Pro and Pro+ plans can access logs for the past three days, while those on Business plans or higher have a 10-day log access window. The Export logs feature is available for Enterprise plans or higher.
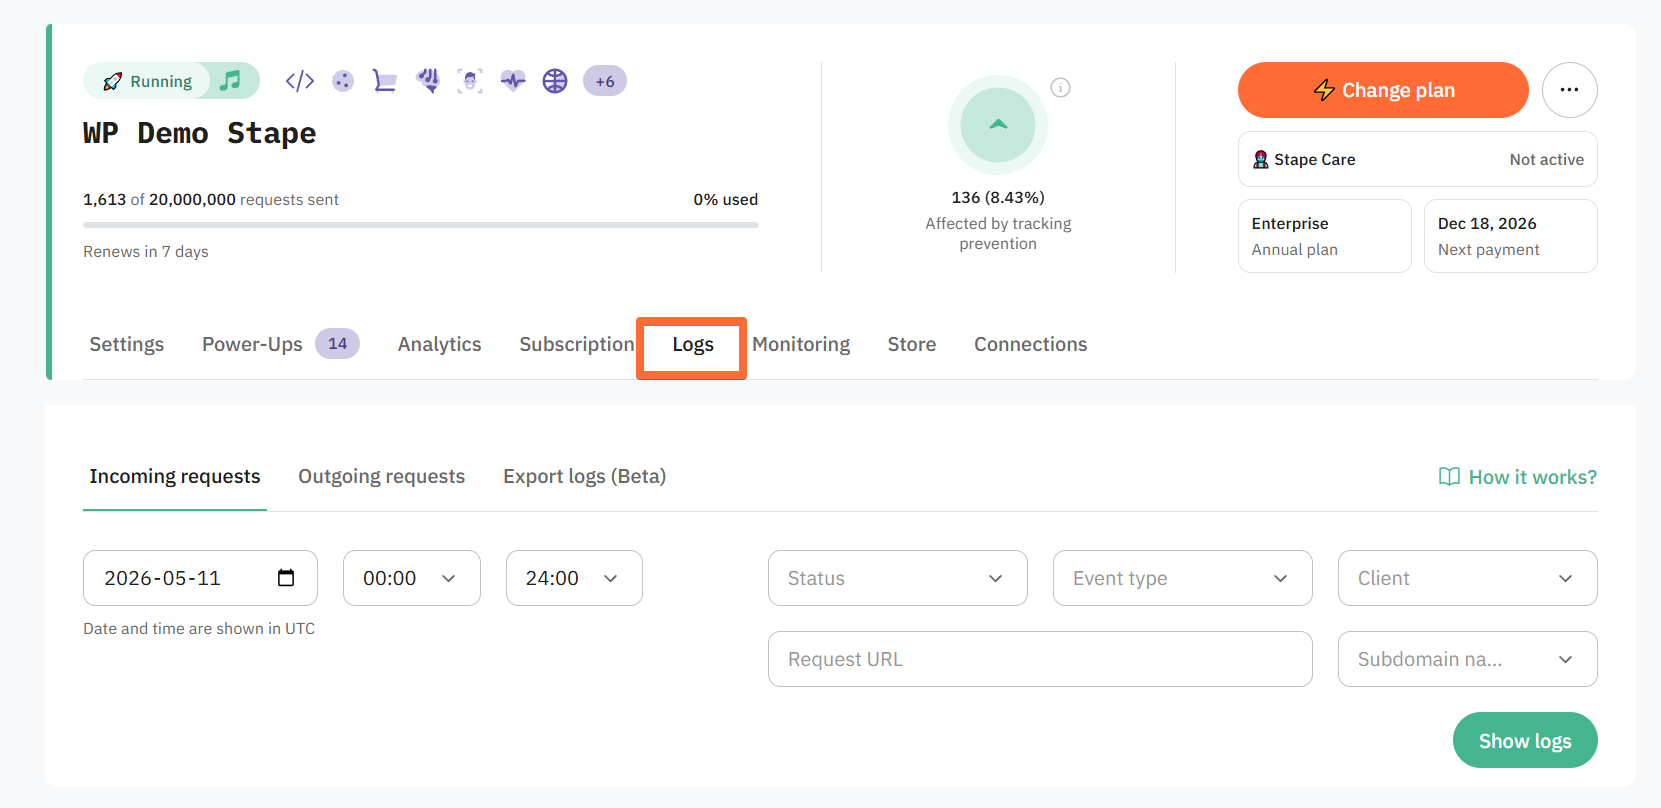
There are two types of logs:
- Incoming requests - the requests that were received by the server GTM.
- Outgoing requests - the requests that have been sent by the server GTM to Facebook, TikTok, and other platforms.
Incoming requests are available by default, and outgoing requests you should activate by switching to the tab “Outgoing requests” and enabling the toggle:
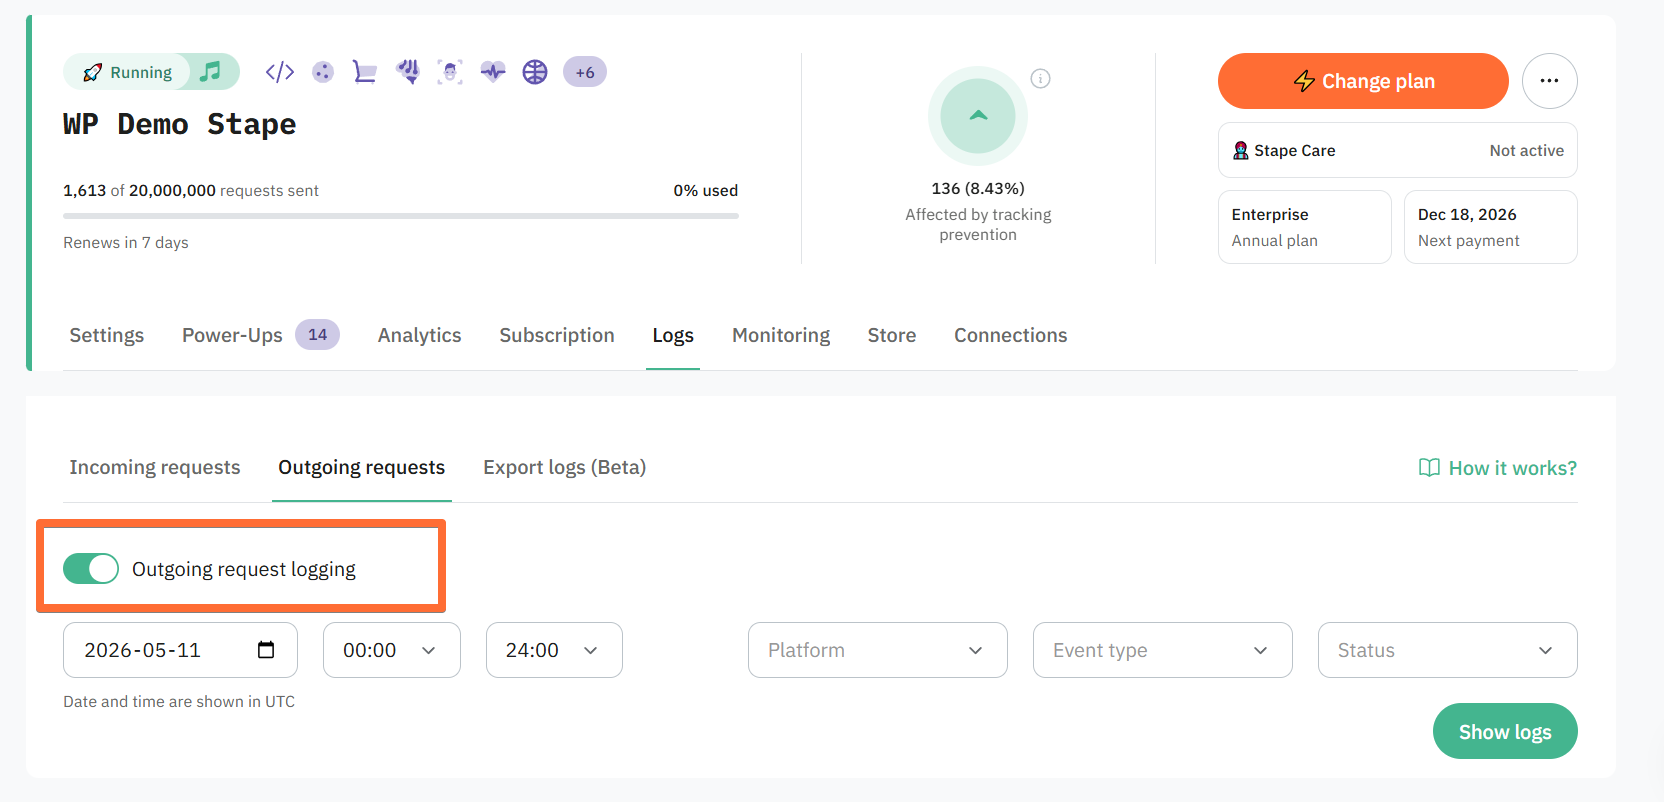
You can also enable the ability to Export logs (available for Enterprise plans or higher). This will automatically export your incoming and outgoing (if configured) logs to a cloud storage of your choosing.
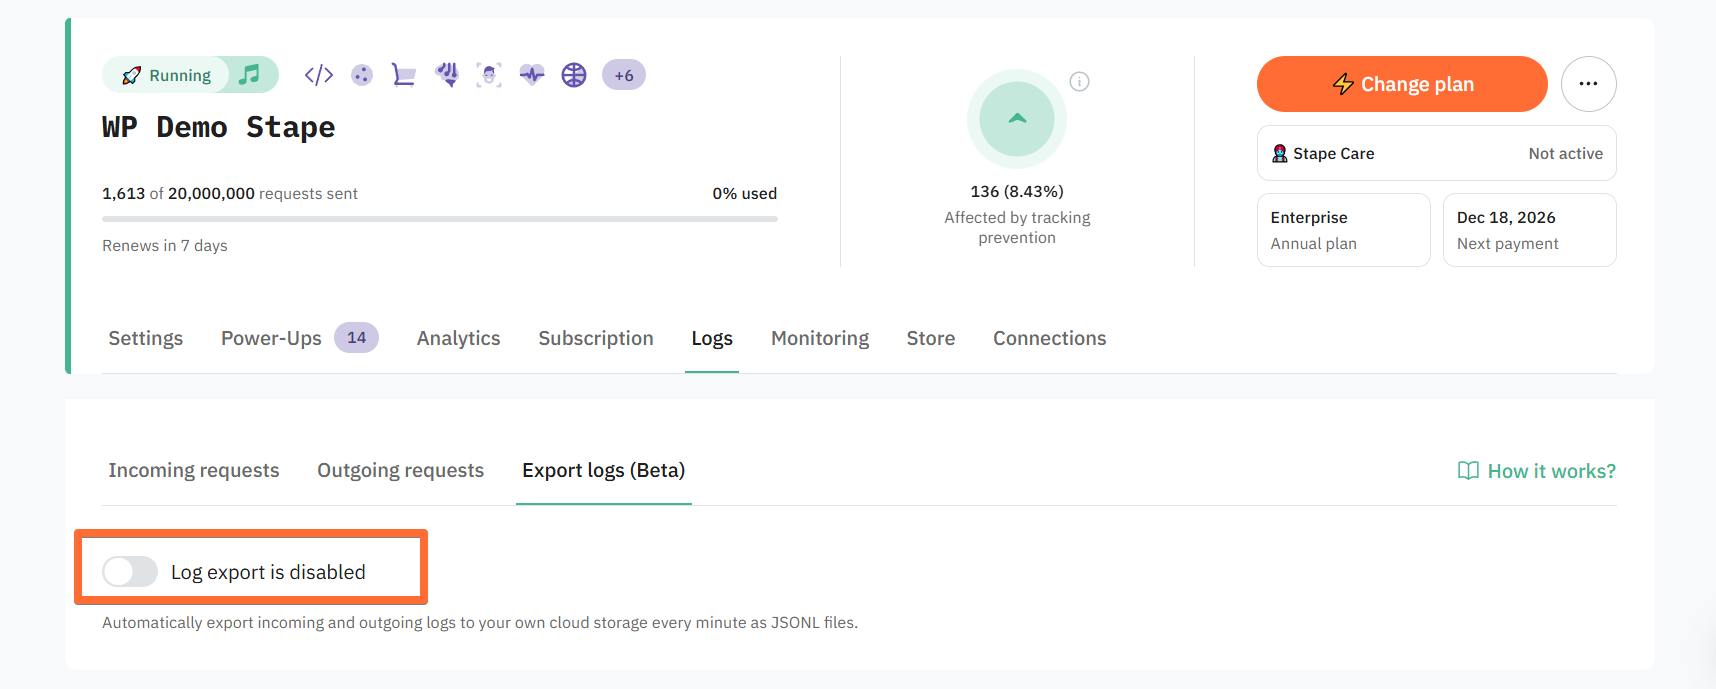
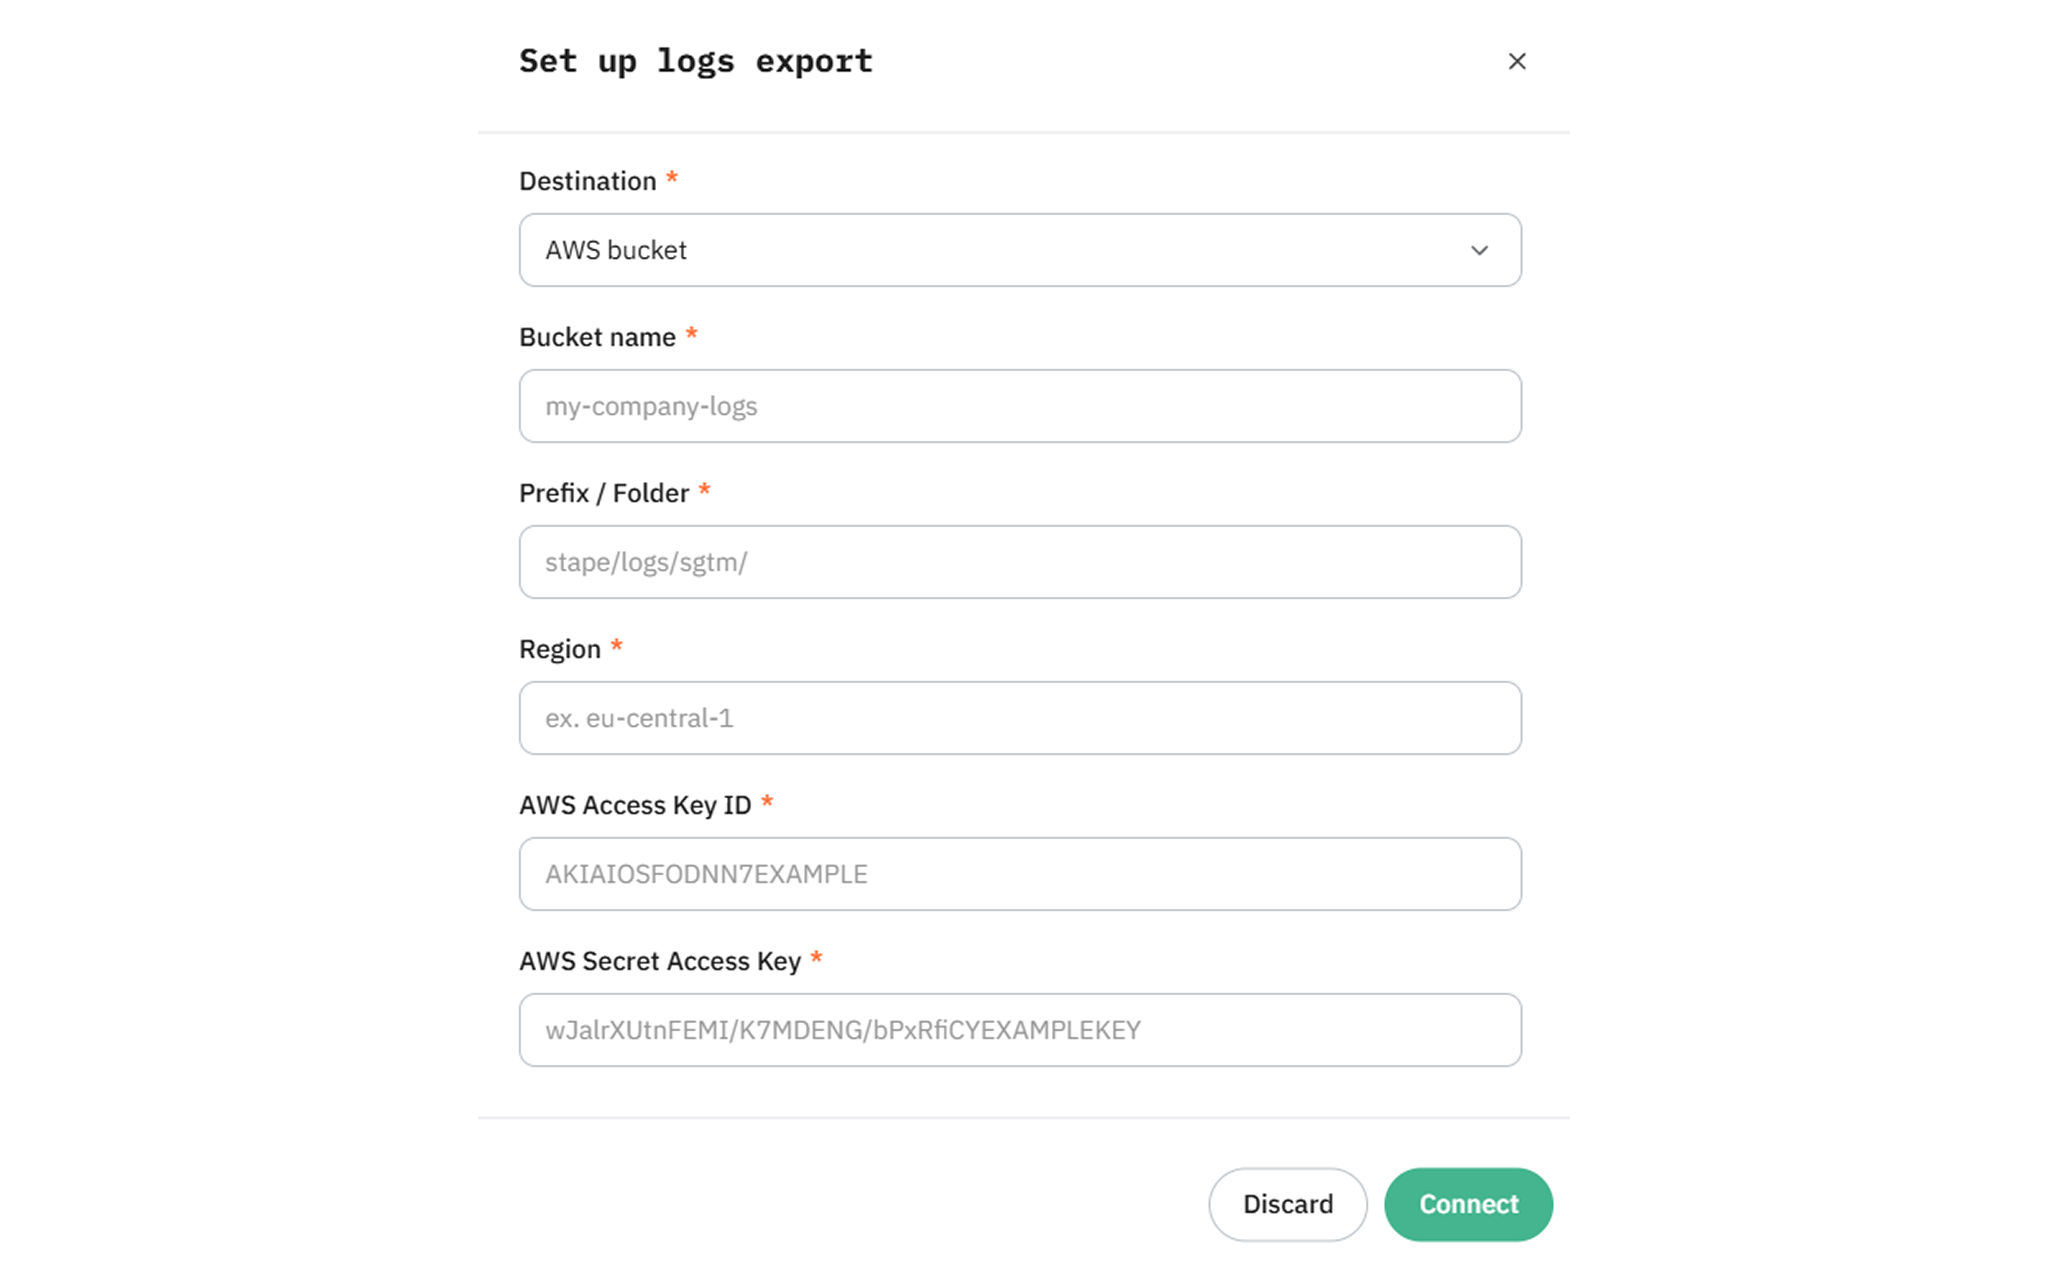
To activate log export, toggle the switch and enter the required information to connect Stape Logs to your cloud storage.
There are multiple use cases on how Stape logs can be used. For instance, you can verify if any events were sent to Facebook that were not processed successfully, meaning that the status code was not 200.
To do so, enable logging of the Facebook tag, as shown in the screenshot above. After collecting request data, open response logs in stape admin and select client and response code. In my case, we're checking Facebook and 4xx responses.
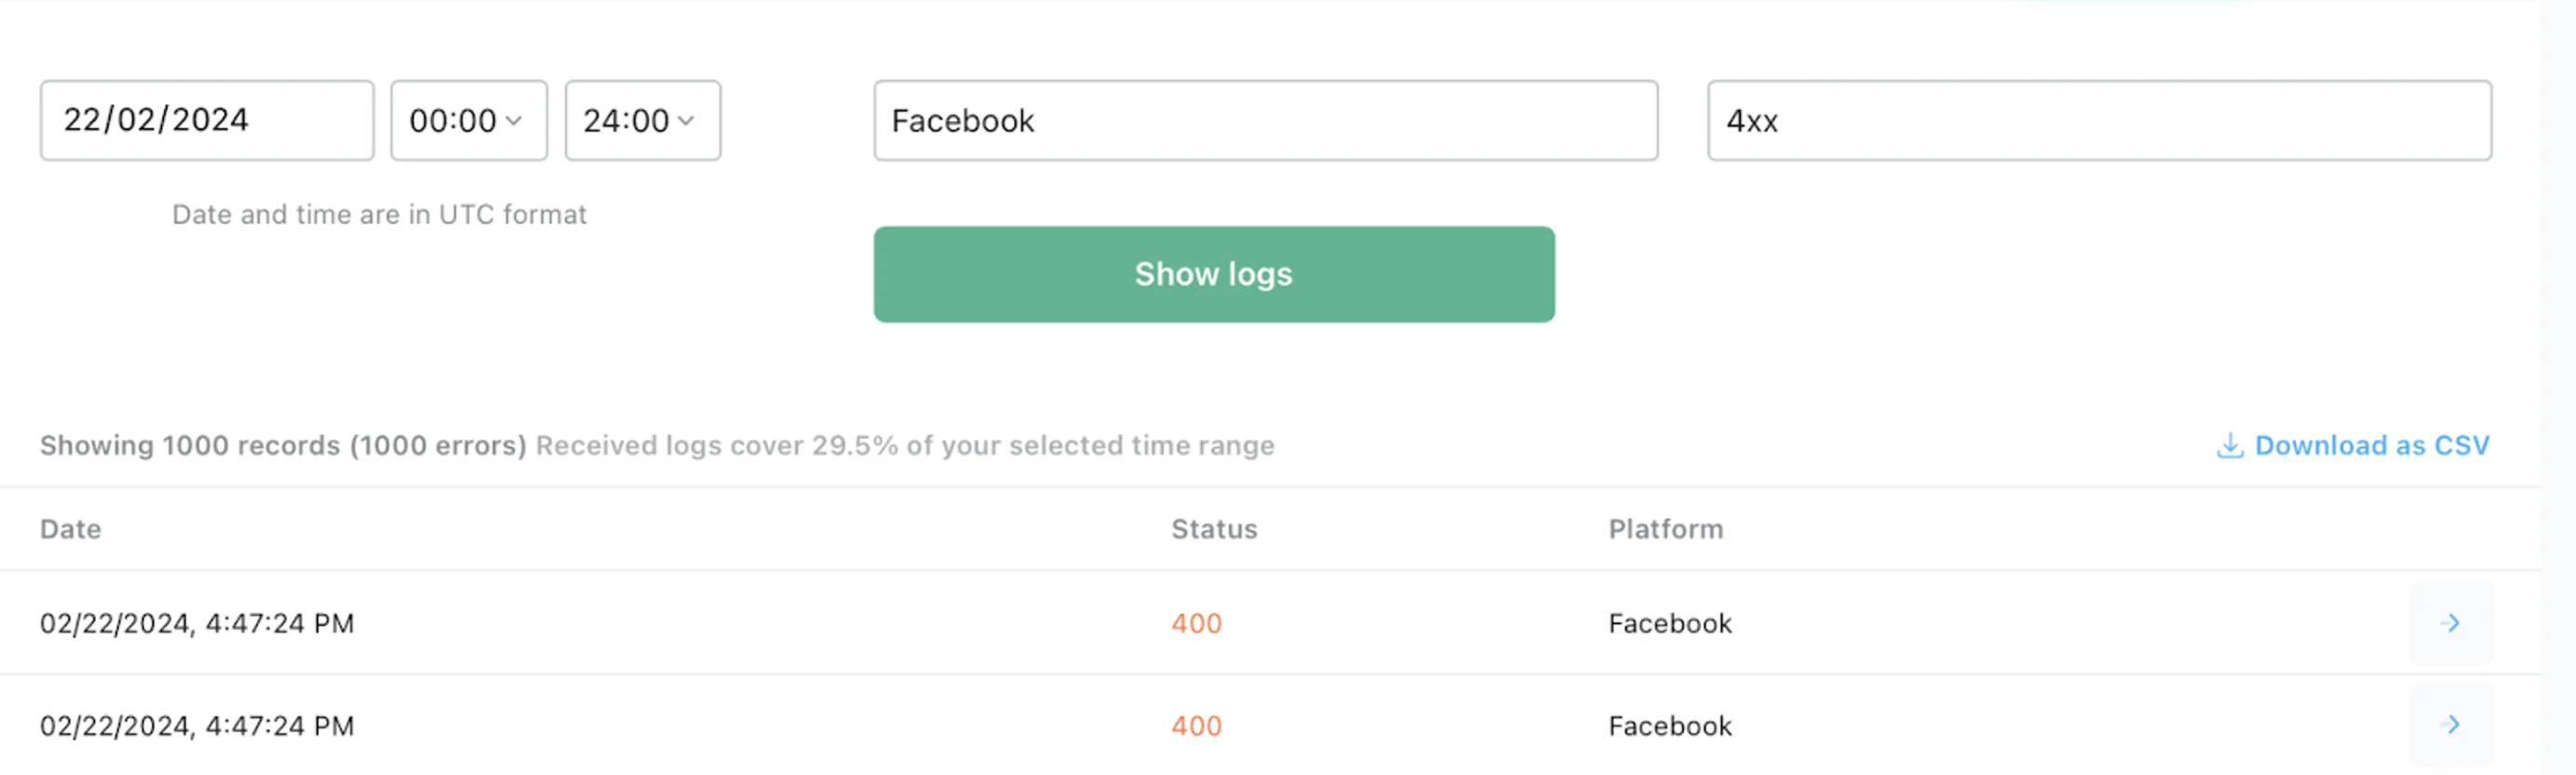
Several events have 400 status. You can click on a row on the right side of each log and see a sequence of access to response logs and troubleshooting in which 400 responses were received.
The easiest way is to find the response body and check its message. In my case, the event wasn’t processed because the parameter was missing.
"ResponseBody": "{"error":{"message": "Invalid parameter," "type": "OAuthException," "code":100, "error_subcode":2804019, "is_transient": false,"error_user_title": "Server Side API Parameter Error," "error_user_msg": "The parameter $['data'][0]['event_name'] is required.","fbtrace_id": "xxxxxxx"}}"
If you're dealing specifically with mismatched numbers between platforms, this guide on data discrepancies troubleshooting breaks down the most common causes and how to resolve them.
Set up BigQuery logging for Stape’s GTM templates
Stape’s GTM templates support logging directly to BigQuery, making it easy to analyze request, response, and message data at scale. To set it up, you just need to enable BigQuery logging in your server GTM tag/variable, add your Dataset and Table IDs, grant access via Stape’s Service Account power-up, and then create a table in BigQuery with the required schema. Once configured, logs will automatically populate, helping you monitor, troubleshoot, and optimize your tracking setup with better visibility. You can check out the full set up guide in the Troubleshooting server-side tagging using server GTM logs article.
Logger Tag
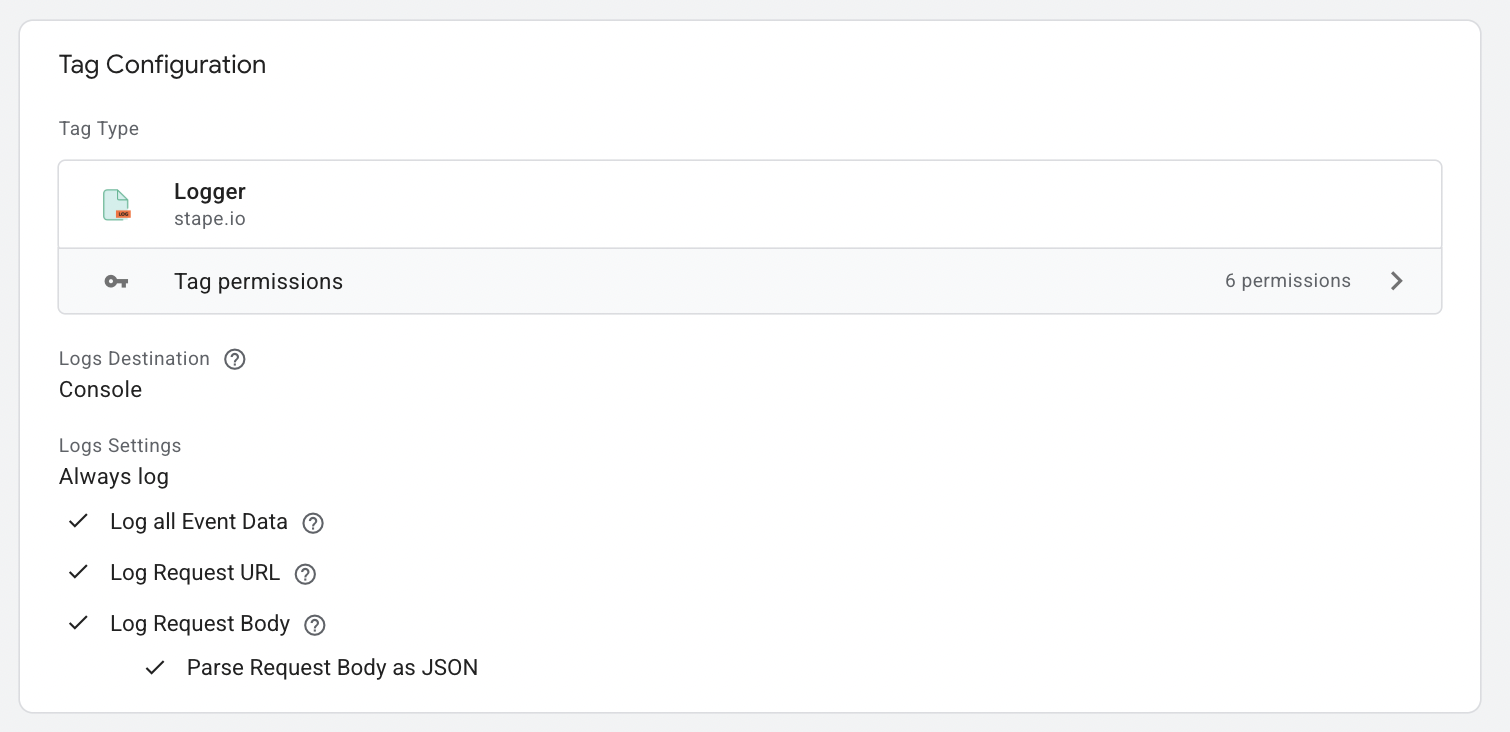
Logger tag for server Google Tag Manager is beneficial for testing POST requests in server GTM. The body of POST requests is not automatically included in logs for Google Cloud or Stape. To access detailed information about POST requests, you should utilize the Logger Tag and activate the 'Log Request Body' option within the tag's settings.
Add the tag from the server GTM tag template gallery. Select the Logs Destination - Console, BigQuery, or Stape Store. If you are a Stape Pro or higher plan user and need to save some storage space in the container, opt for Stape Store as the logs destination. BigQuery as Logs Destination is more complex and requires creating a table in BigQuery.
For both Logs Destinations, you need to select if you want to log events only while debugging or always → Select what information you want to add to logs → add event name. You can use either static or dynamic name → add custom data if needed → add a trigger.
You can learn more about our Logger tag in the article here.
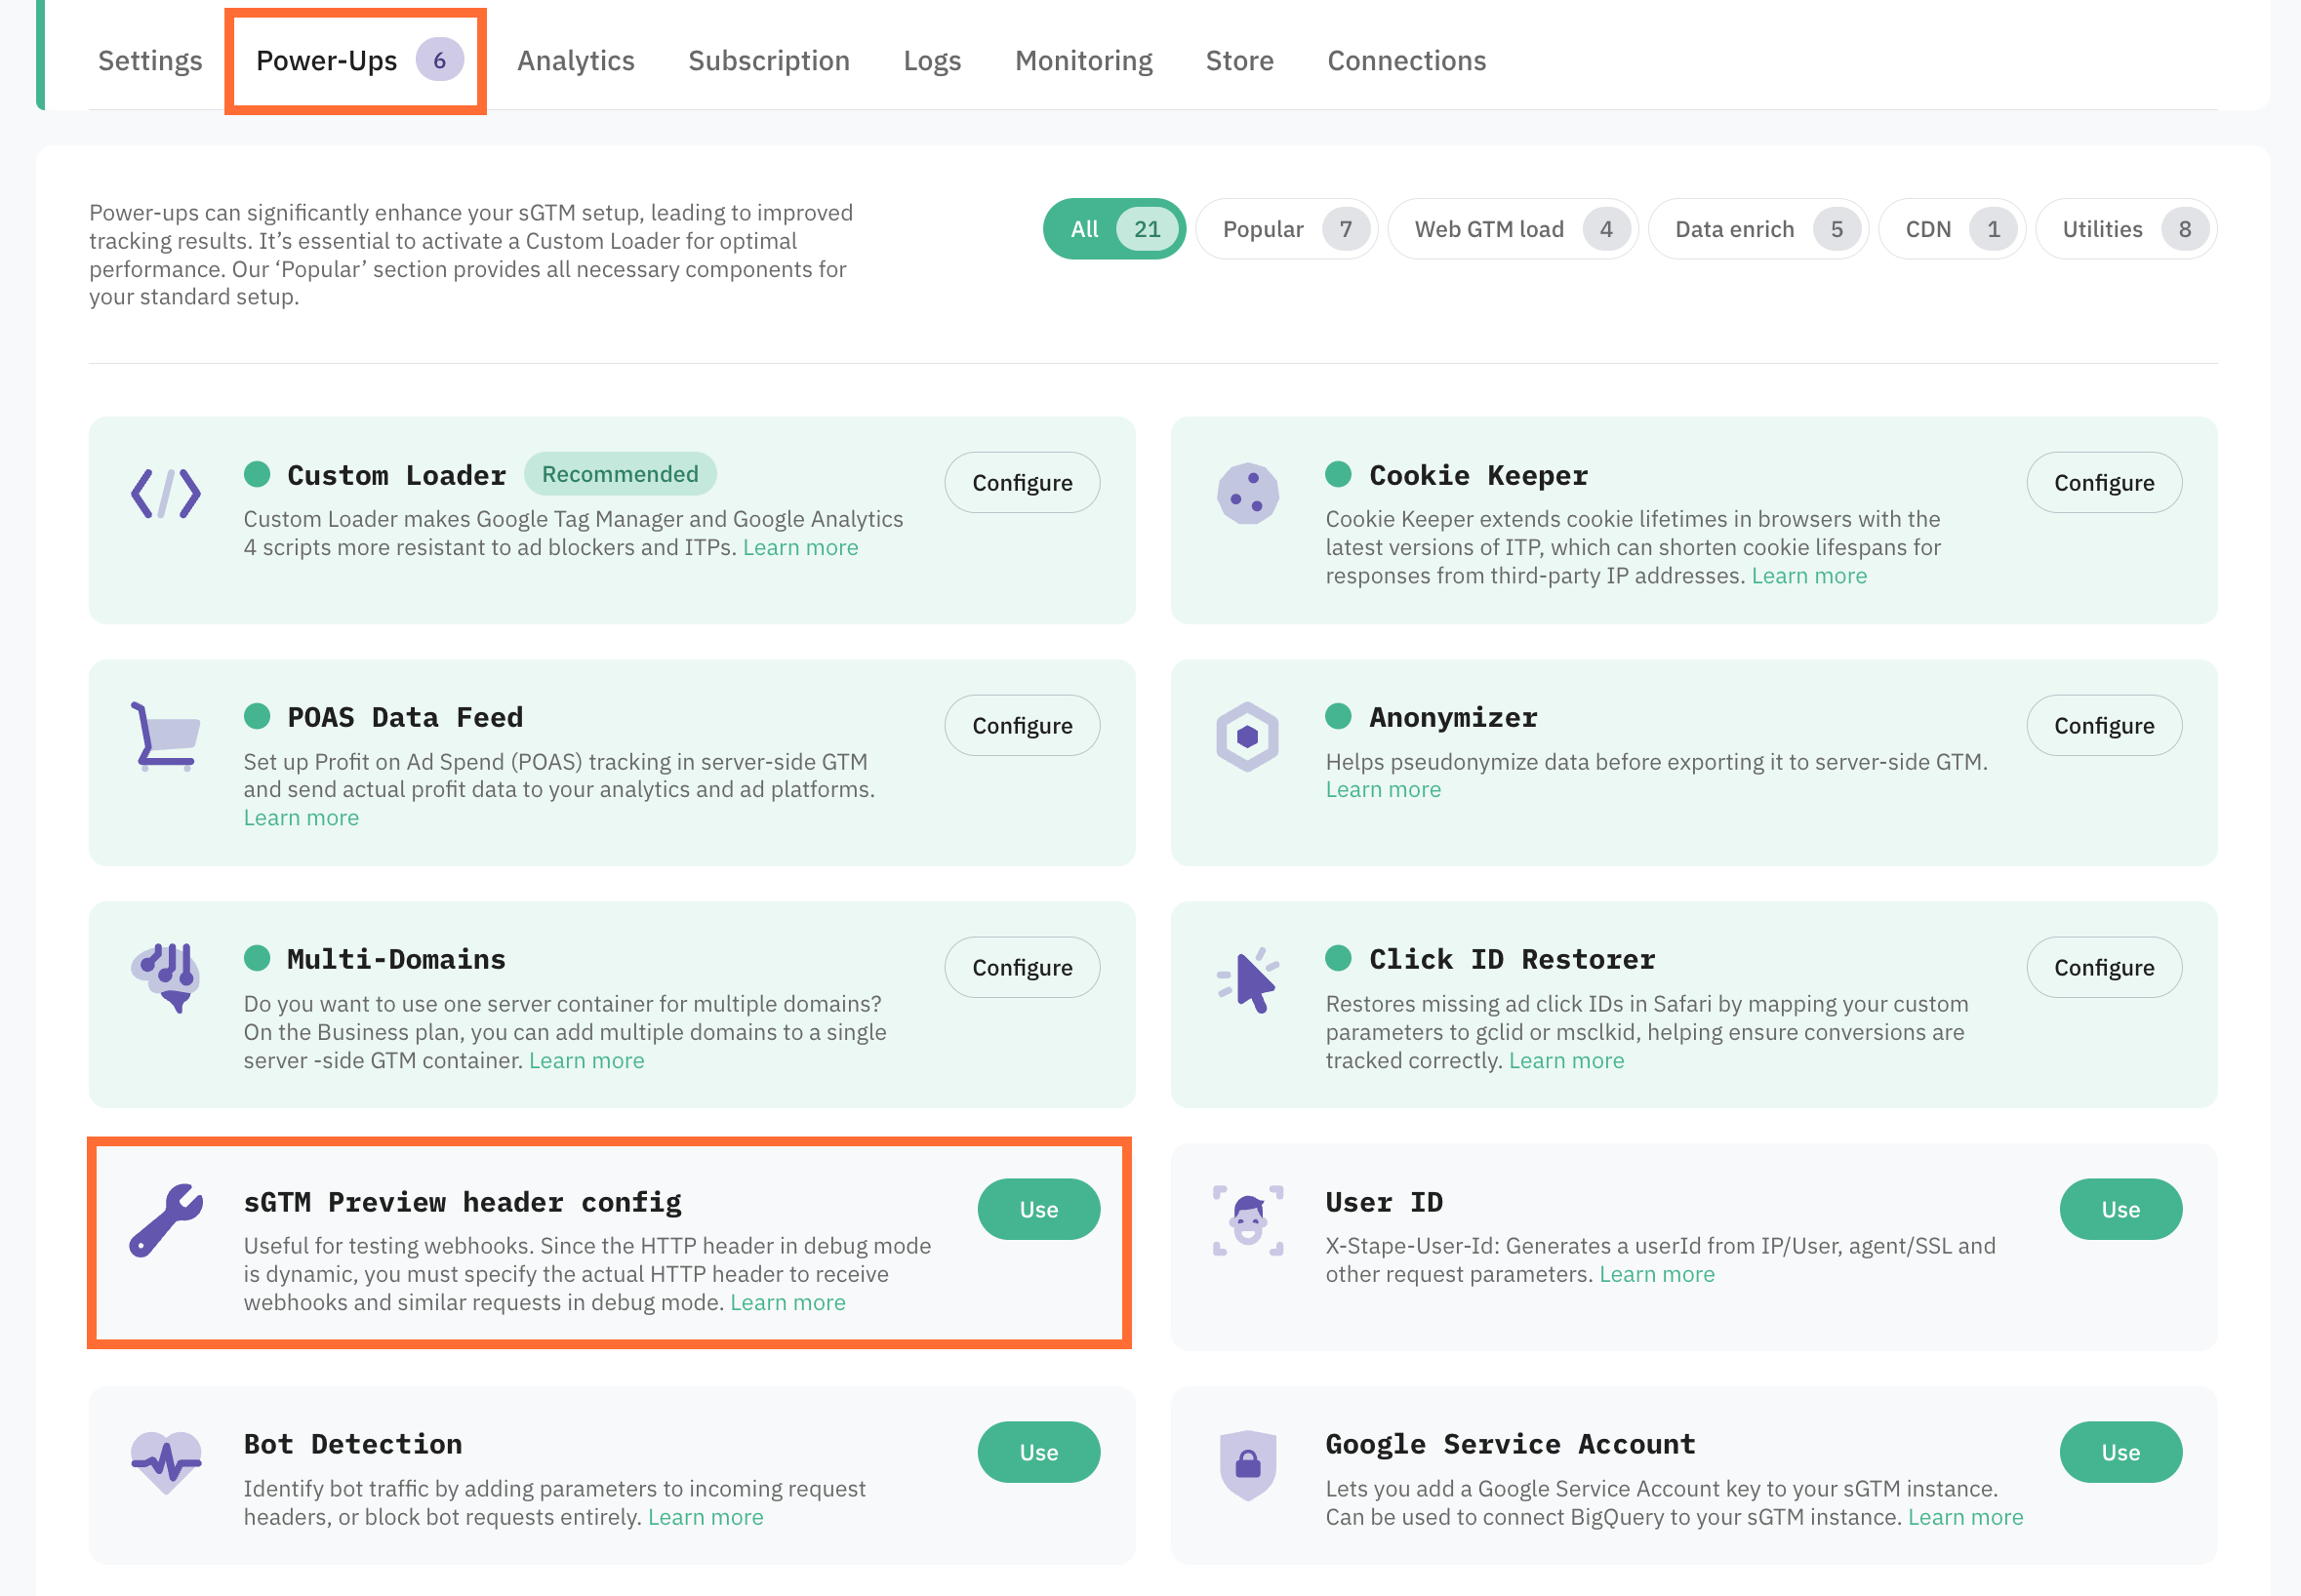
sGTM Preview header config
The sGTM Preview header configuration is a power-up available for all Stape users. It's handy for viewing requests in the sGTM debugger when sending them to sGTM from outside the Web GTM. For example, you can debug webhooks sent to your sGTM container.
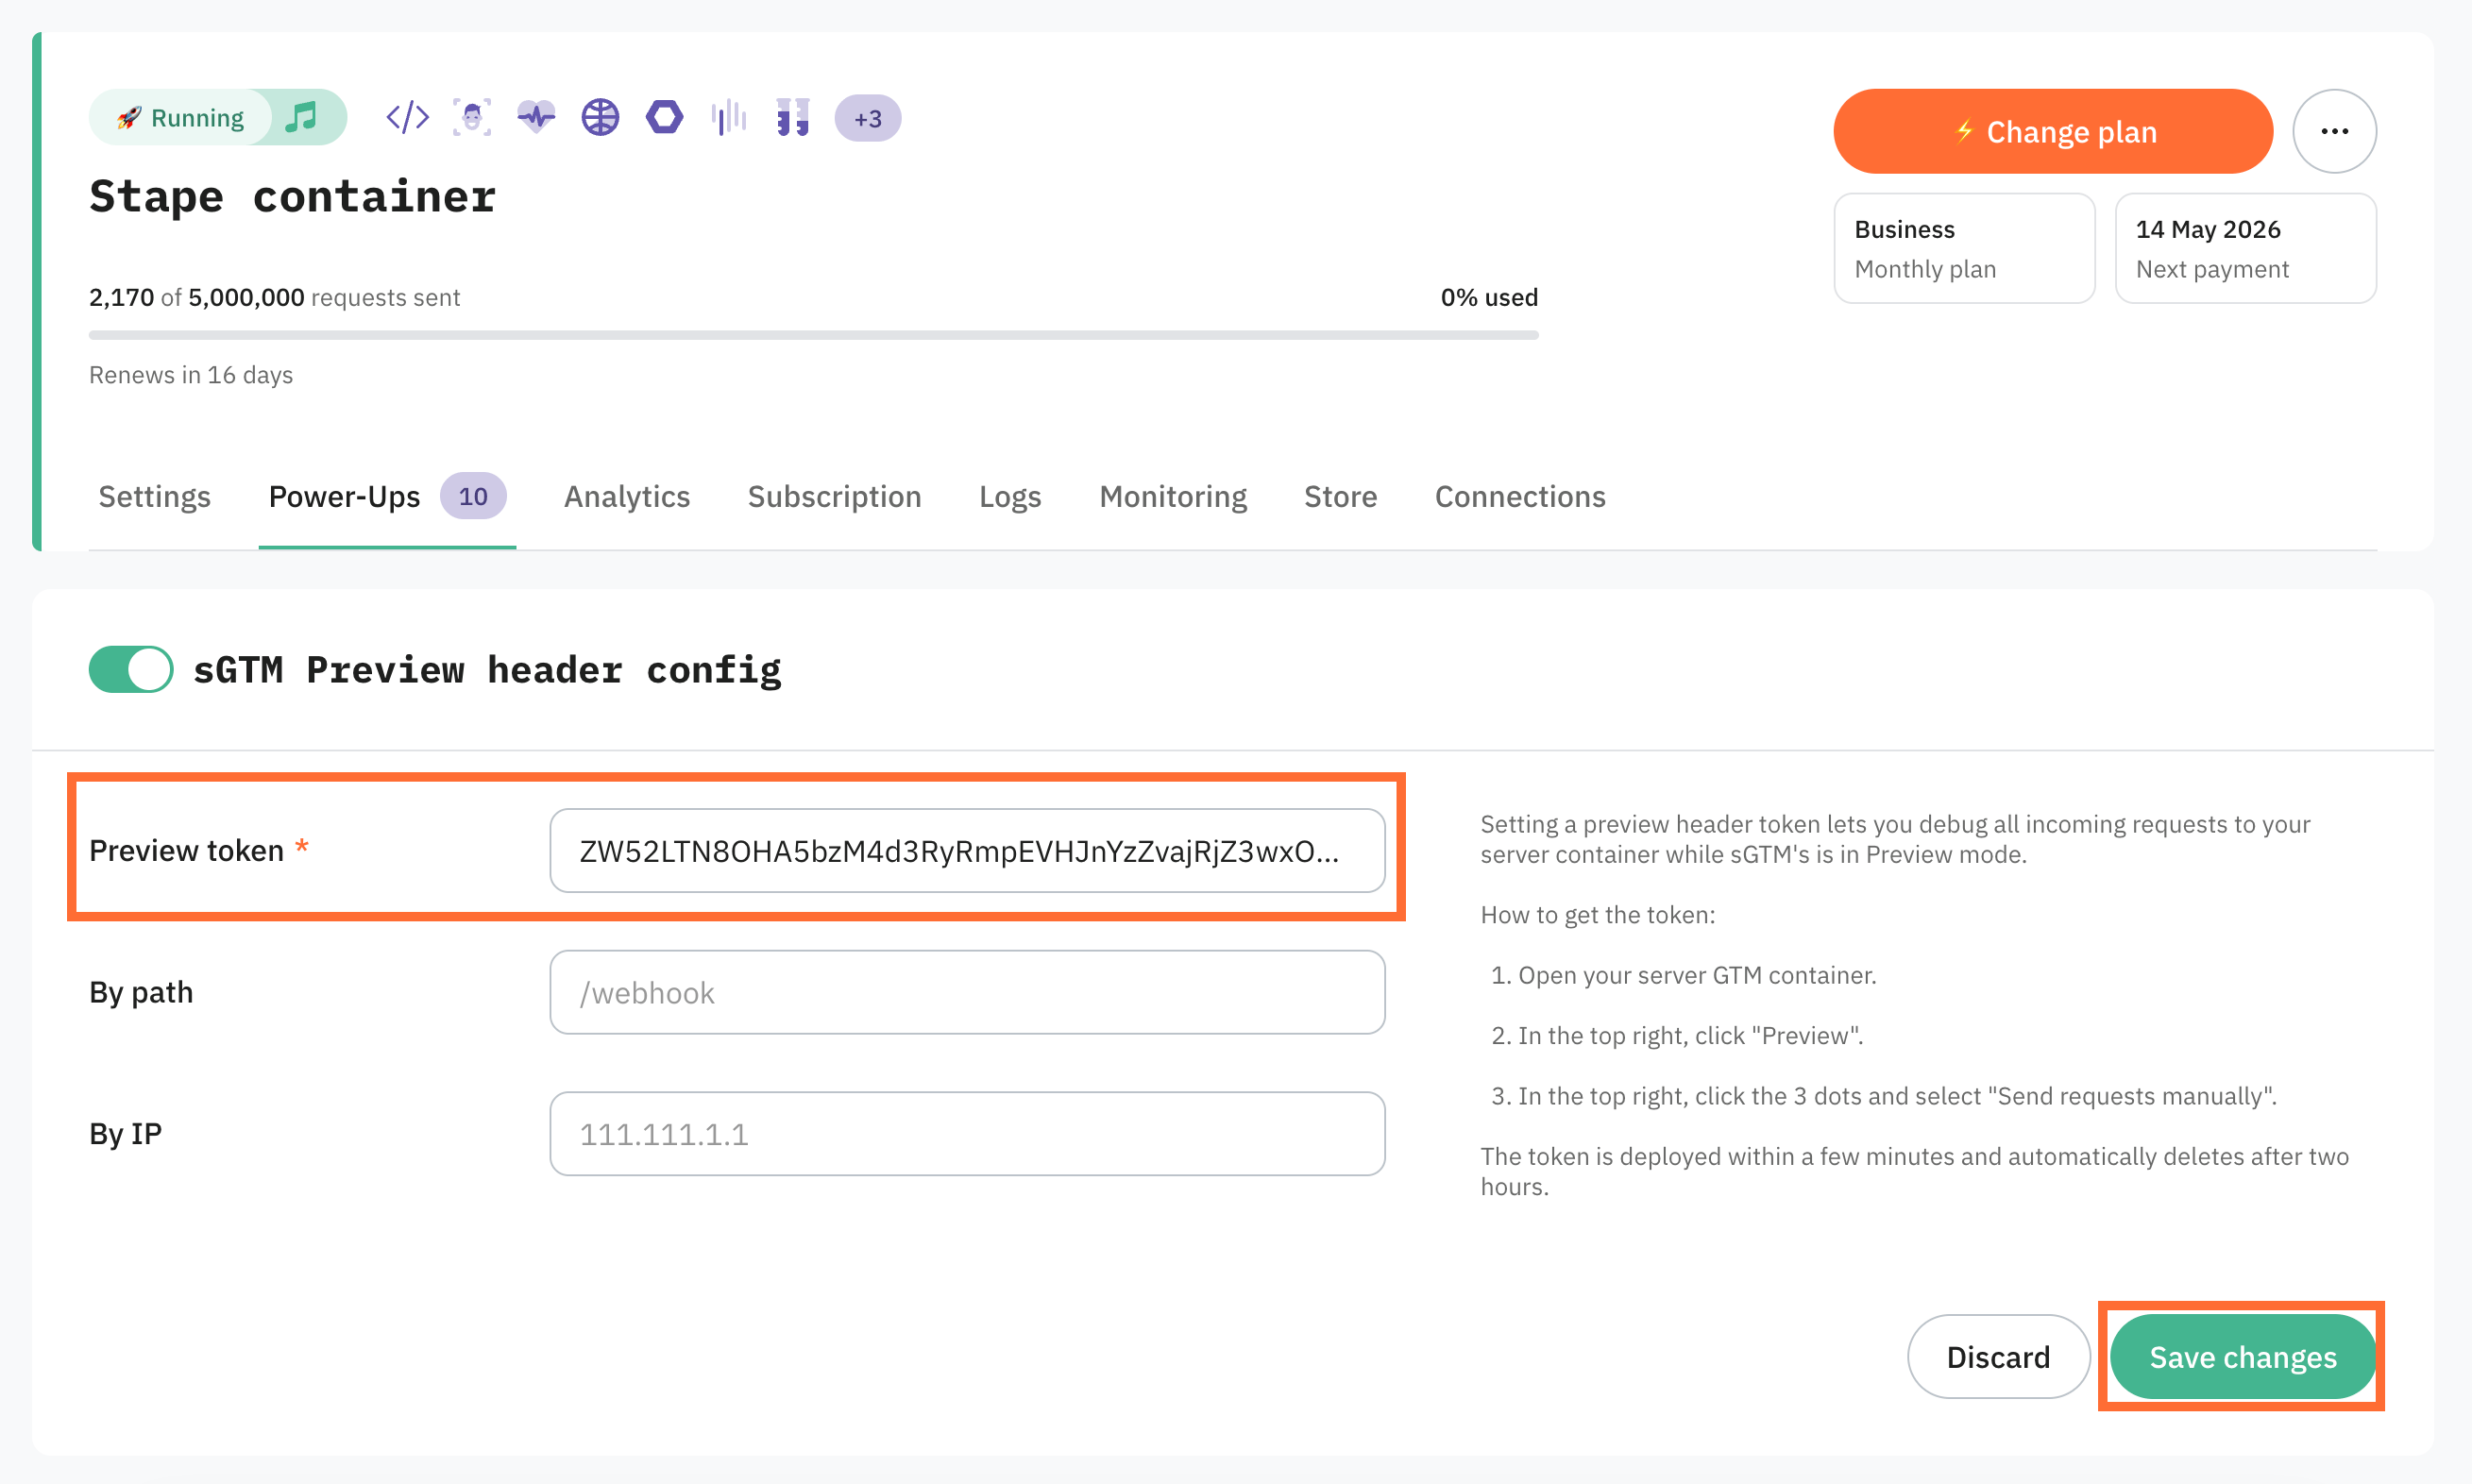
To use this power-up, open sGTM's preview mode (“Preview” in the top right of your workspace). Then, in the top right corner, click on the three dots, select 'send request manually,' and copy the preview header.
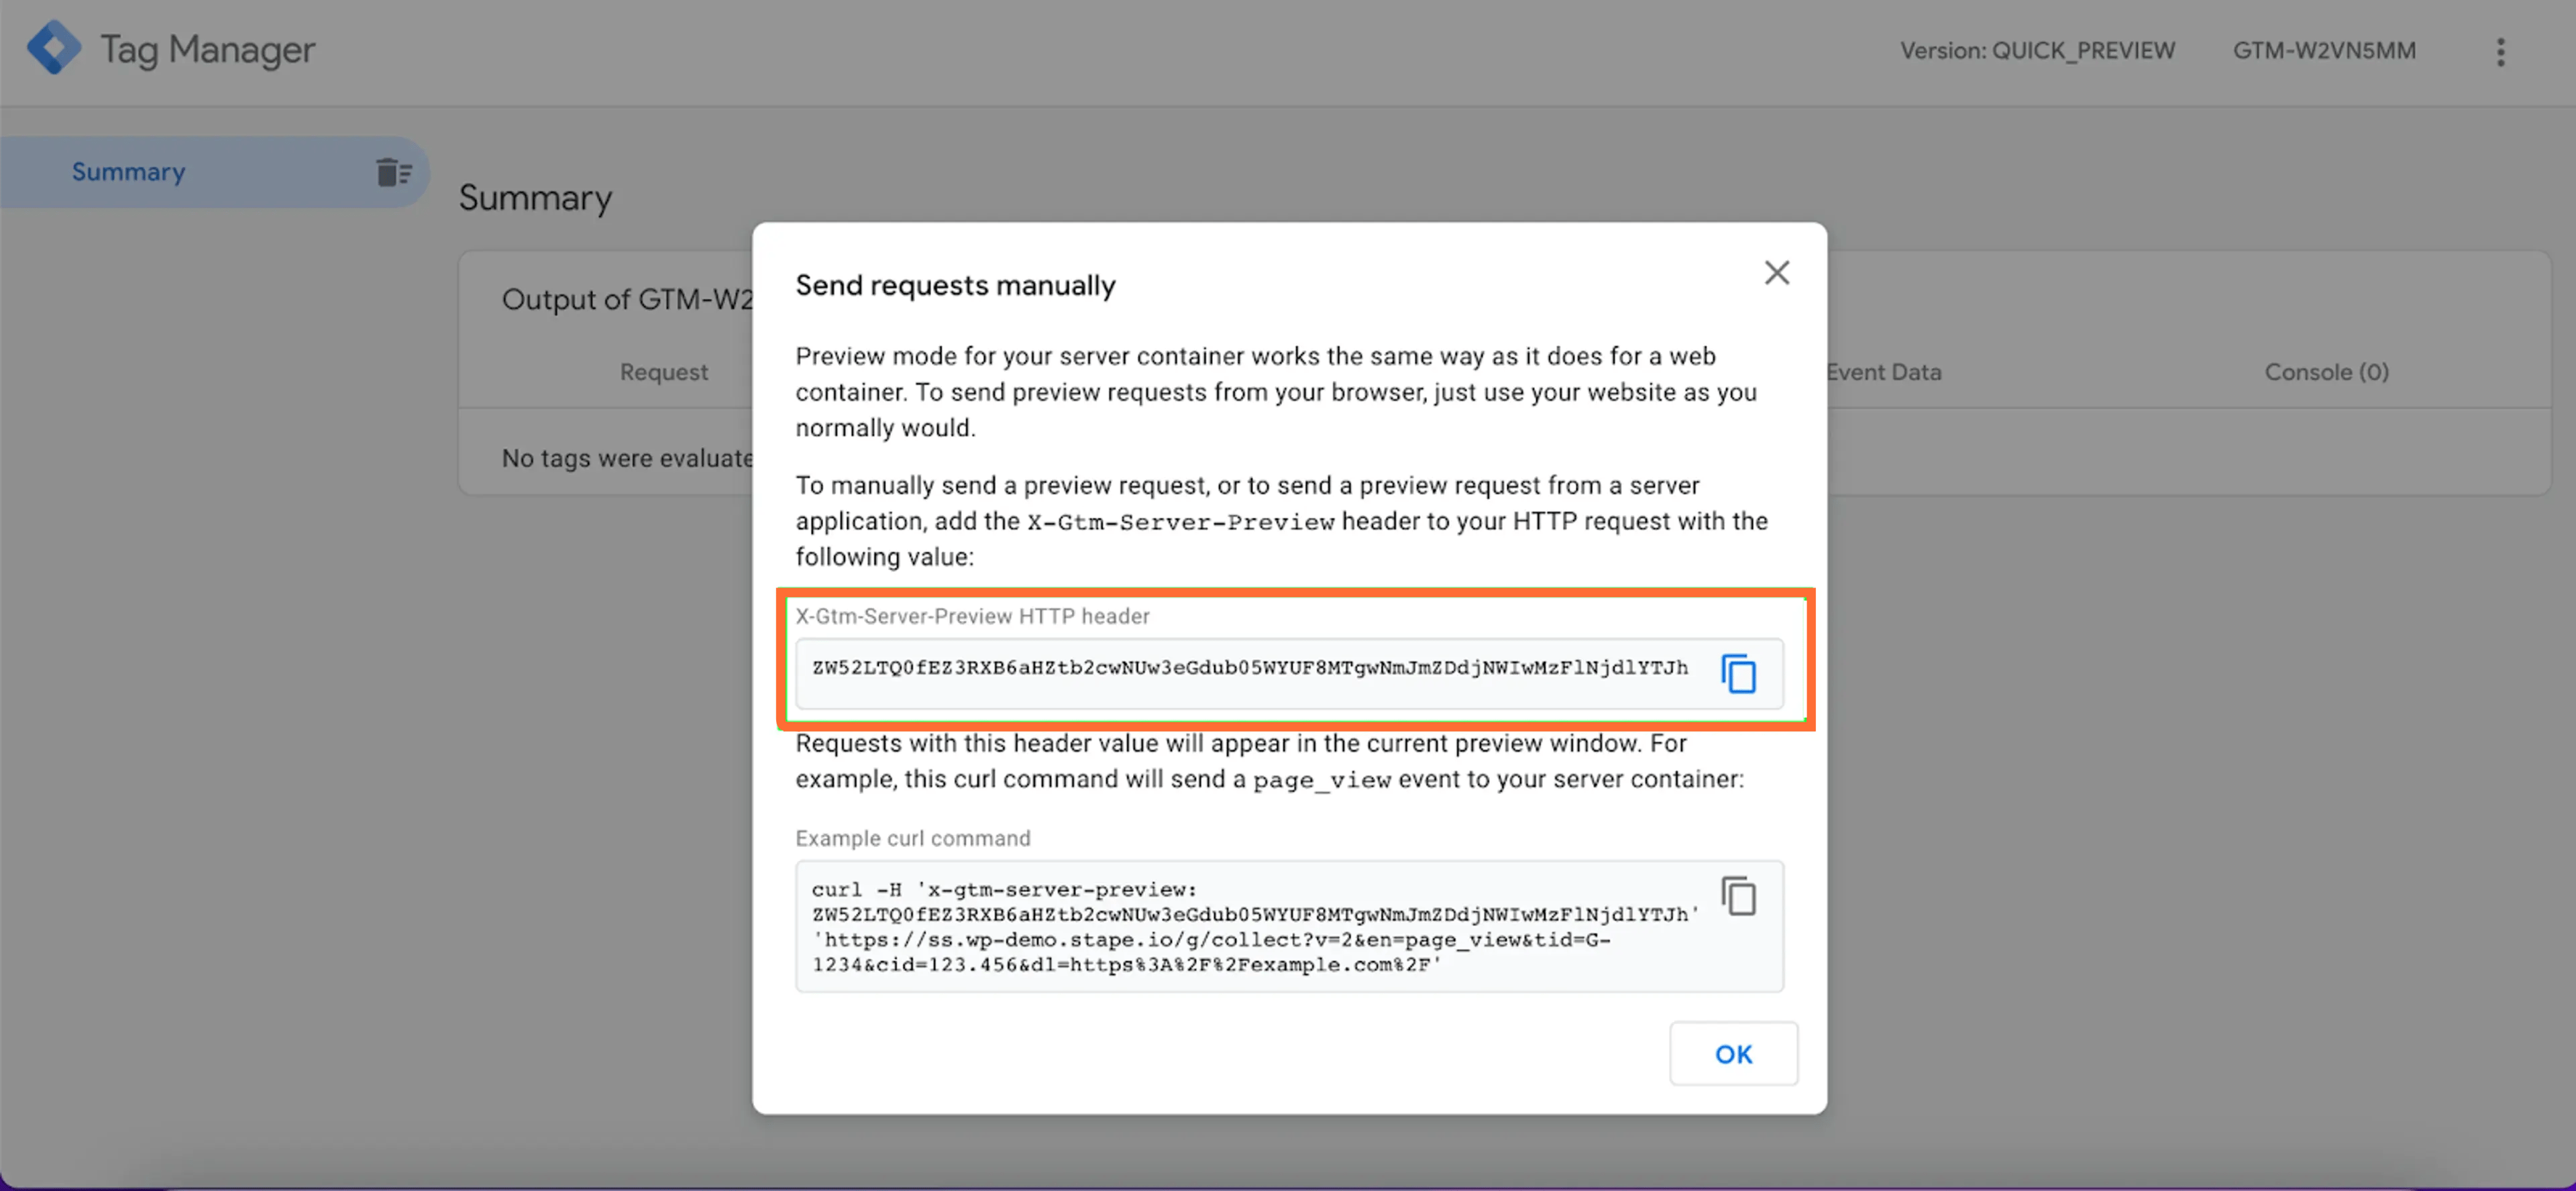
Next, insert this header into your Stape container settings.
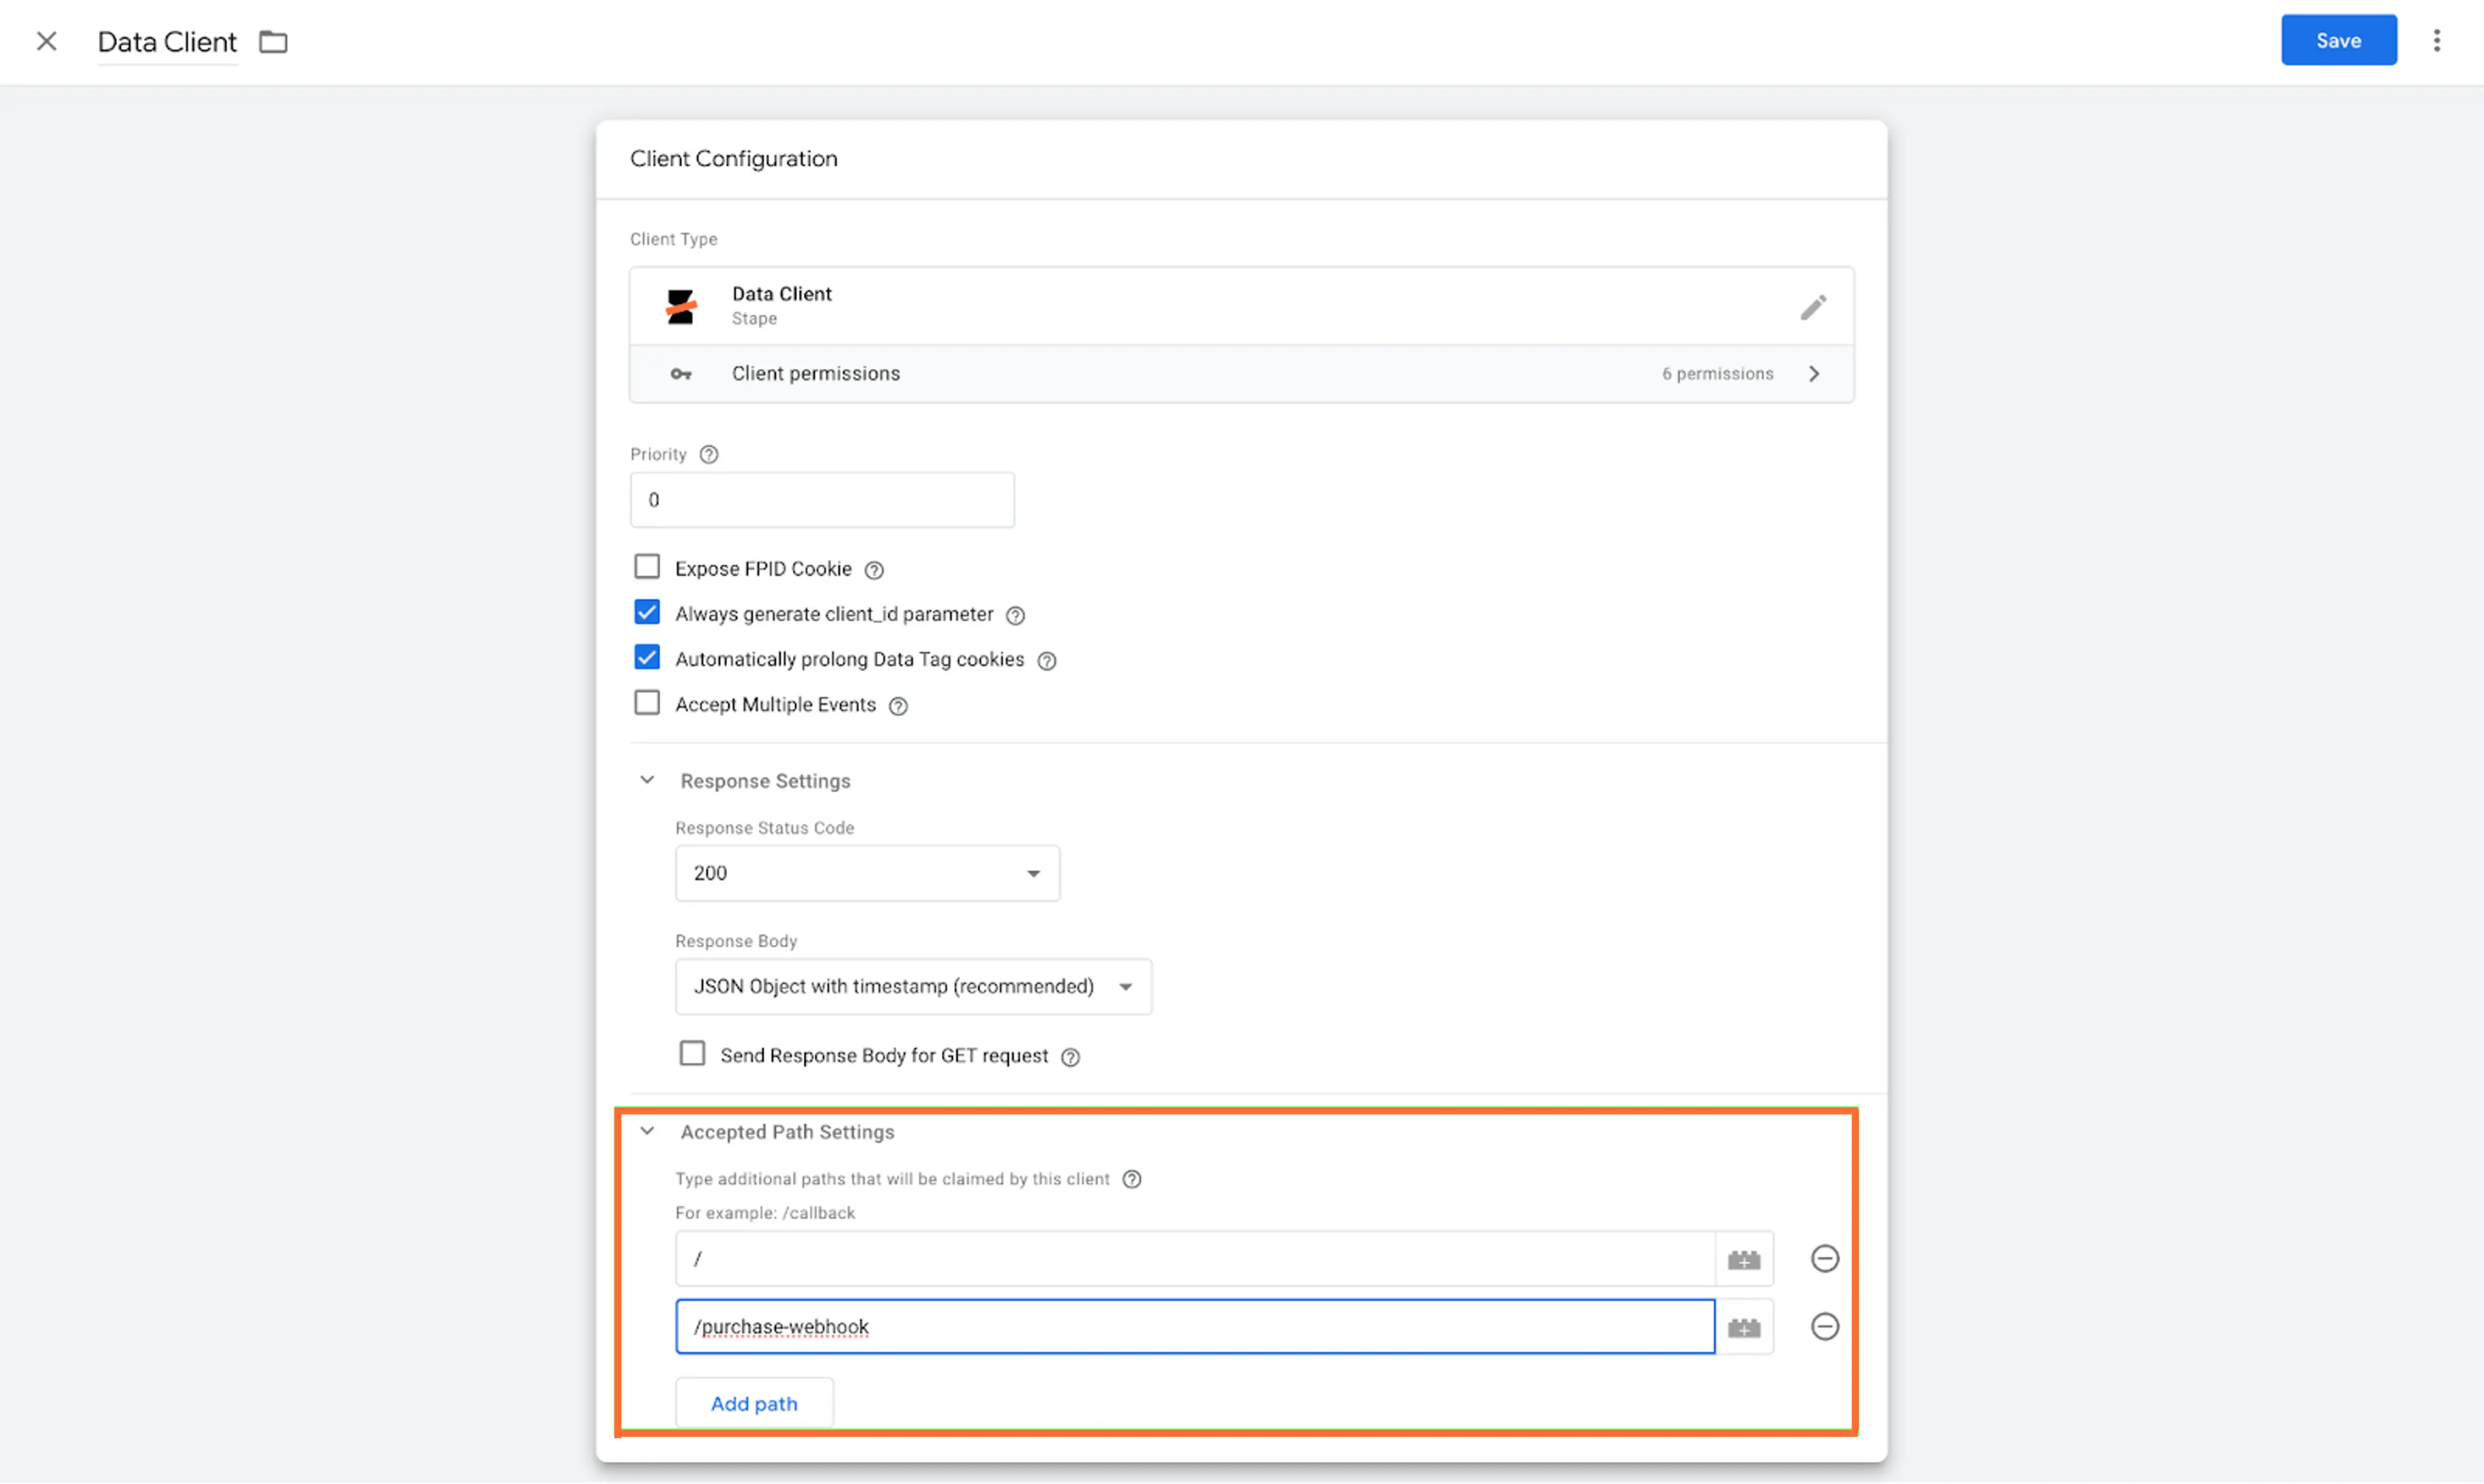
To retrieve webhook requests in sGTM, add a Data Client to your sGTM container and create a Client with the type Data Client. Scroll down to the accepted path setting and add a path to which the webhook was sent. For more information, check out our guide on how to use webhooks in sGTM.
Remember, the preview header changes dynamically. Therefore, removing it from your stape.io account after completing your tests is crucial to ensure future requests are visible in the sGTM debugger. If you did not turn off the sGTM Preview header config, stape will automatically turn it off in 30 minutes.
Monitoring feature
The monitoring feature is helpful for ongoing monitoring of your server GTM container work and the correct excursion of tags. It allows you to set rules that will send email notifications or Slack notifications when the rule is triggered. For example, you can receive a notification when the number of purchases sent in GA4 equals 0.
Imagine you are checking your Facebook campaign results, and suddenly you discover that despite spending your entire budget, you've recorded zero conversions for several days :(
Often, this is due to an oversight during your site update, like removing a GTM snippet or disrupting the purchase event data layer.
These minor errors can cost an arm and a leg, as they hinder ad optimization and obscure the true ROAS of your campaigns. At Stape, we've experienced these challenges firsthand, so we've introduced a Monitoring feature to help reduce the impact of such issues. It is available to all Stape sGTM hosting users with Business, Enterprise, and Custom plans.
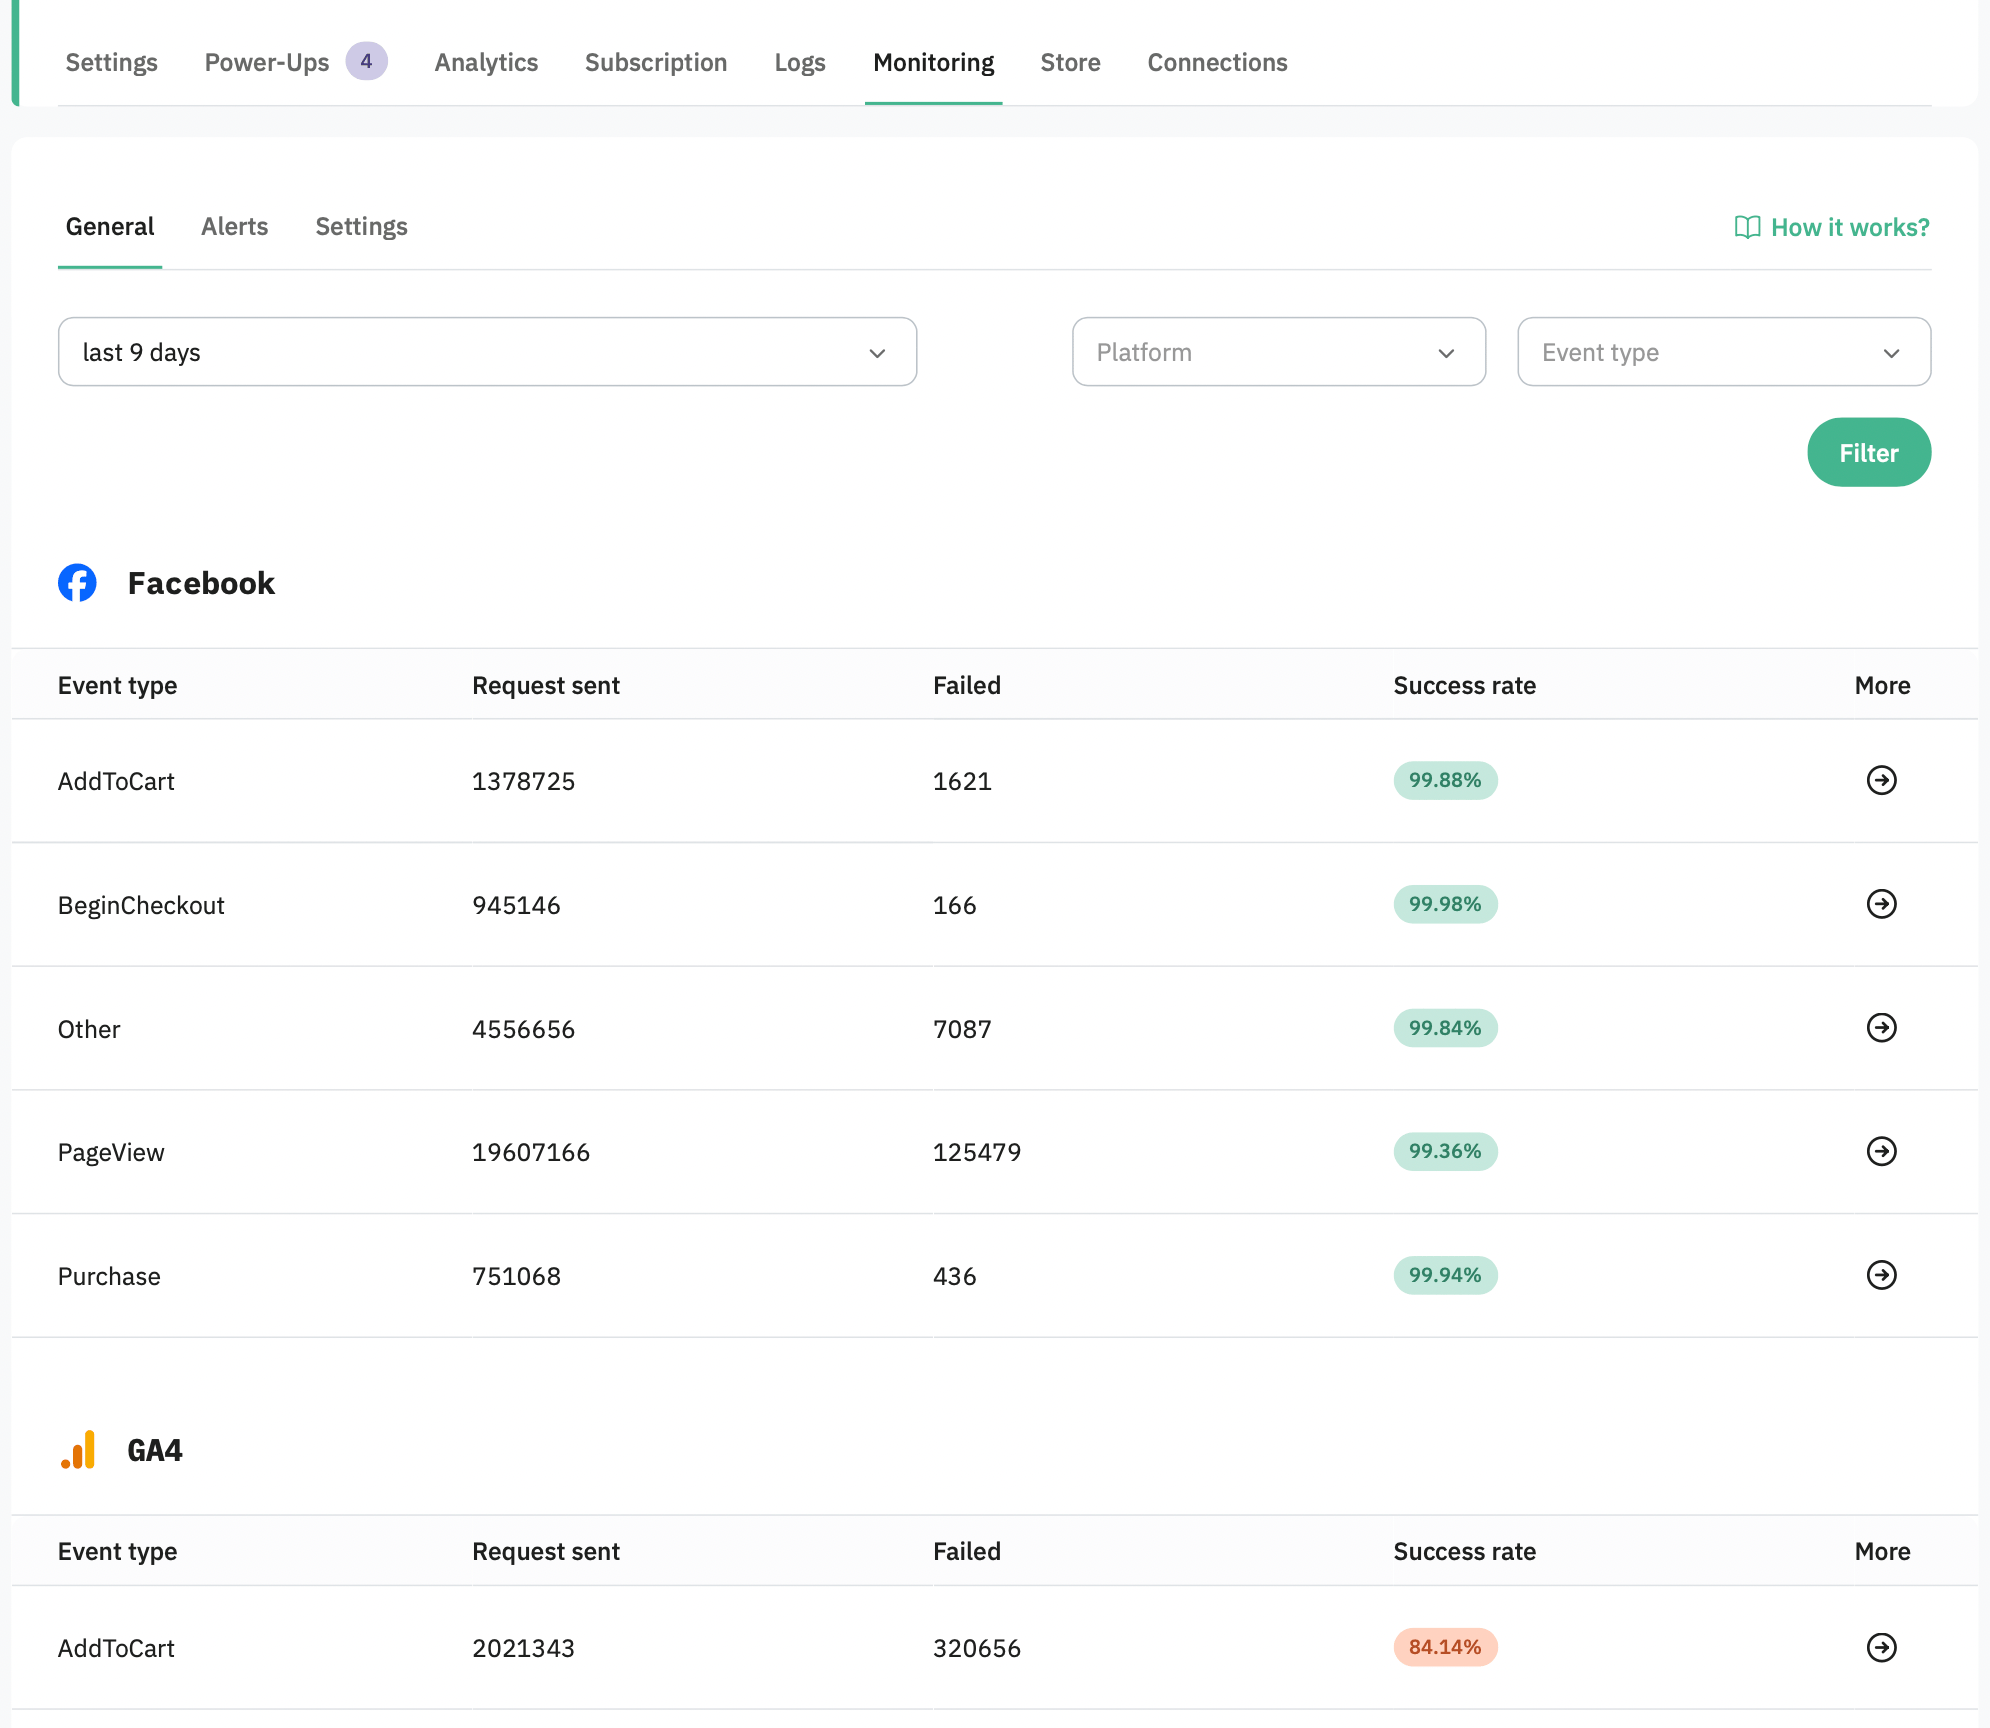
You can create, edit, or delete your container monitoring notifications. To do so, open the sGTM container and click on the Monitoring tab. If you already have some rules configured, you will see the list of rules in this tab, whether they were triggered, the number of times they were detected, and the last detected time.
Monitoring alerts work based on the container logs:
- Incoming Logs capture all incoming requests to the container. For instance, GA4 requests sent via POST may not fully display in these logs, with details like event names missing. These logs are ideal for monitoring webhooks or tallying total container requests.
- Outgoing Logs detail outgoing requests and are exclusive to tags created by Stape. They function only when given consent to track and store outgoing requests
The notification settings include:
- Domain: determines whether the rule applies to all container domains or only selected ones.
- Frequency: specifies the interval for evaluating conditions.
- Criteria: involves configuring specific conditions like event, client, platform, and status code. Alerts are triggered only when all these criteria are met.
- Alert Activation: the alert is initiated based on the volume of requests (exceeding or falling short) that align with the defined conditions.
You can find the configuration examples and more information on our feature Monitoring in this article.
Conclusion
To wrap up, knowing how to debug server-side tracking is critical for reliable and accurate data. This guide has shown you tools like the sGTM Debugger, Stape Logs, Logger Tag, Preview Header, and Monitoring.
Each tool helps find and fix tracking errors. Good debugging isn't just about solving problems now; it's about constantly monitoring which data is received and sent to each vendor and checking the setup when data does not look correct.
We hope this guide has made you more skilled in server-side tagging debugging, making your data gathering solid and meaningful. Keep exploring and let your data lead you to more tremendous success in digital analytics and marketing.
Would like to receive help with the setup?
Don't worry, we've got you covered! Click on Get assistance and we will send you a free quote.

Comments