Essential eCommerce KPIs to measure and maximize performance
Liudmyla Kharchenko
AuthorOnline shopping shows no signs of slowing down. As of 2025, around 2.77 billion people are shopping online, and that’s over a third of the global population. eCommerce now accounts for more than 21% of total retail sales worldwide. The global mobile commerce market is making up around 60% of all global eCommerce sales.
Watching the right numbers in your business is really important. Whether you have a small online store or a growing brand, tracking key performance indicators (KPIs) helps you see what’s working, what’s not, and where you can do better. In this post, we’ll break down 20 simple but important eCommerce KPIs you should track to help your business grow in 2025.
What are eCommerce KPIs?
| eCommerce KPIs, or Key Performance Indicators, are specific, measurable values that reflect how effectively an online business is performing and achieving its core objectives. KPIs are strategic indicators that tie directly to your business goals, whether it’s increasing revenue, improving customer retention, lowering acquisition costs, or increasing average order value. |
eCommerce KPIs, or Key Performance Indicators, are specific, measurable values that reflect how effectively an online business is performing and achieving its core objectives. KPIs are strategic indicators that tie directly to your business goals, whether it’s increasing revenue, improving customer retention, lowering acquisition costs, or increasing average order value.
In a nutshell, KPIs help you get more success in the areas that matter most to your business by providing a clear assessment of its performance. For example, let’s say your main goal is to improve profitability. In this scenario, you care most about KPIs like conversion rate, customer lifetime value, and return on ad spend.
What makes KPI powerful is their ability to turn numbers into actionable insights, so you’re not just tracking data for the sake of it, but using the data you get.
Many KPIs, such as conversion rate or return on ad spend, are calculated by dividing one metric by another to derive meaningful insights.
In eCommerce nowadays, customer expectations and digital trends change quickly. KPIs are needed to stay focused, agile, and competitive. eCommerce brands rely on these KPIs to measure success, identify opportunities, and stay ahead in a rapidly evolving market.
Importance of key performance indicators for eCommerce
The current eCommerce market is more saturated and competitive than ever, so an average eCommerce business owner is not simply running an online store, but also managing complex logistics, paid ads across multiple platforms, and trying to keep up with customer expectations shaped by giants like Amazon. Key performance metrics are essential for understanding business success and making informed decisions in this environment.
Without the right KPIs, you risk making budget decisions in the dark. Here’s a quick breakdown of the top seven reasons why KPIs, eCommerce context taken into consideration, matter:
1. See what’s working.
KPIs show if your marketing, website, and sales efforts are bringing results. Tracking website traffic and website visitors helps you measure which channels are most effective.
2. Avoid wasting money.
Metrics like CAC (Customer Acquisition Cost) tell you if you’re paying too much to get a customer.
3. Spot problems early.
High cart abandonment or bounce rates mean something in your store is turning people away.
4. Prove your results.
If you run ads or work with a team, KPIs give complex numbers to show what’s bringing sales, including measuring the impact of advertising efforts.
5. Keep up with changes.
With privacy regulations and changes in 2025, KPIs based on your own (first-party) data are more critical than ever.
6. Know if you’re ahead or behind.
Comparing your KPIs to industry averages shows where you stand.
7. Grow the right way.
Focusing on KPIs like repeat purchase rate and CLV (Customer Lifetime Value) helps you keep customers longer, not just chase new ones.
It is crucial to understand the impact of online marketing activities, know your eCommerce funnel, and how attribution influences it. Tracking online sales and monitoring eCommerce website performance are key to optimizing your business. Understanding different marketing attribution models will help you see what KPIs and eCommerce strategies are the best fit for your business.
20 Key eCommerce KPIs
These 20 key eCommerce KPIs cover everything from sales and customer behavior to marketing and inventory, the must-know numbers to watch in 2025.
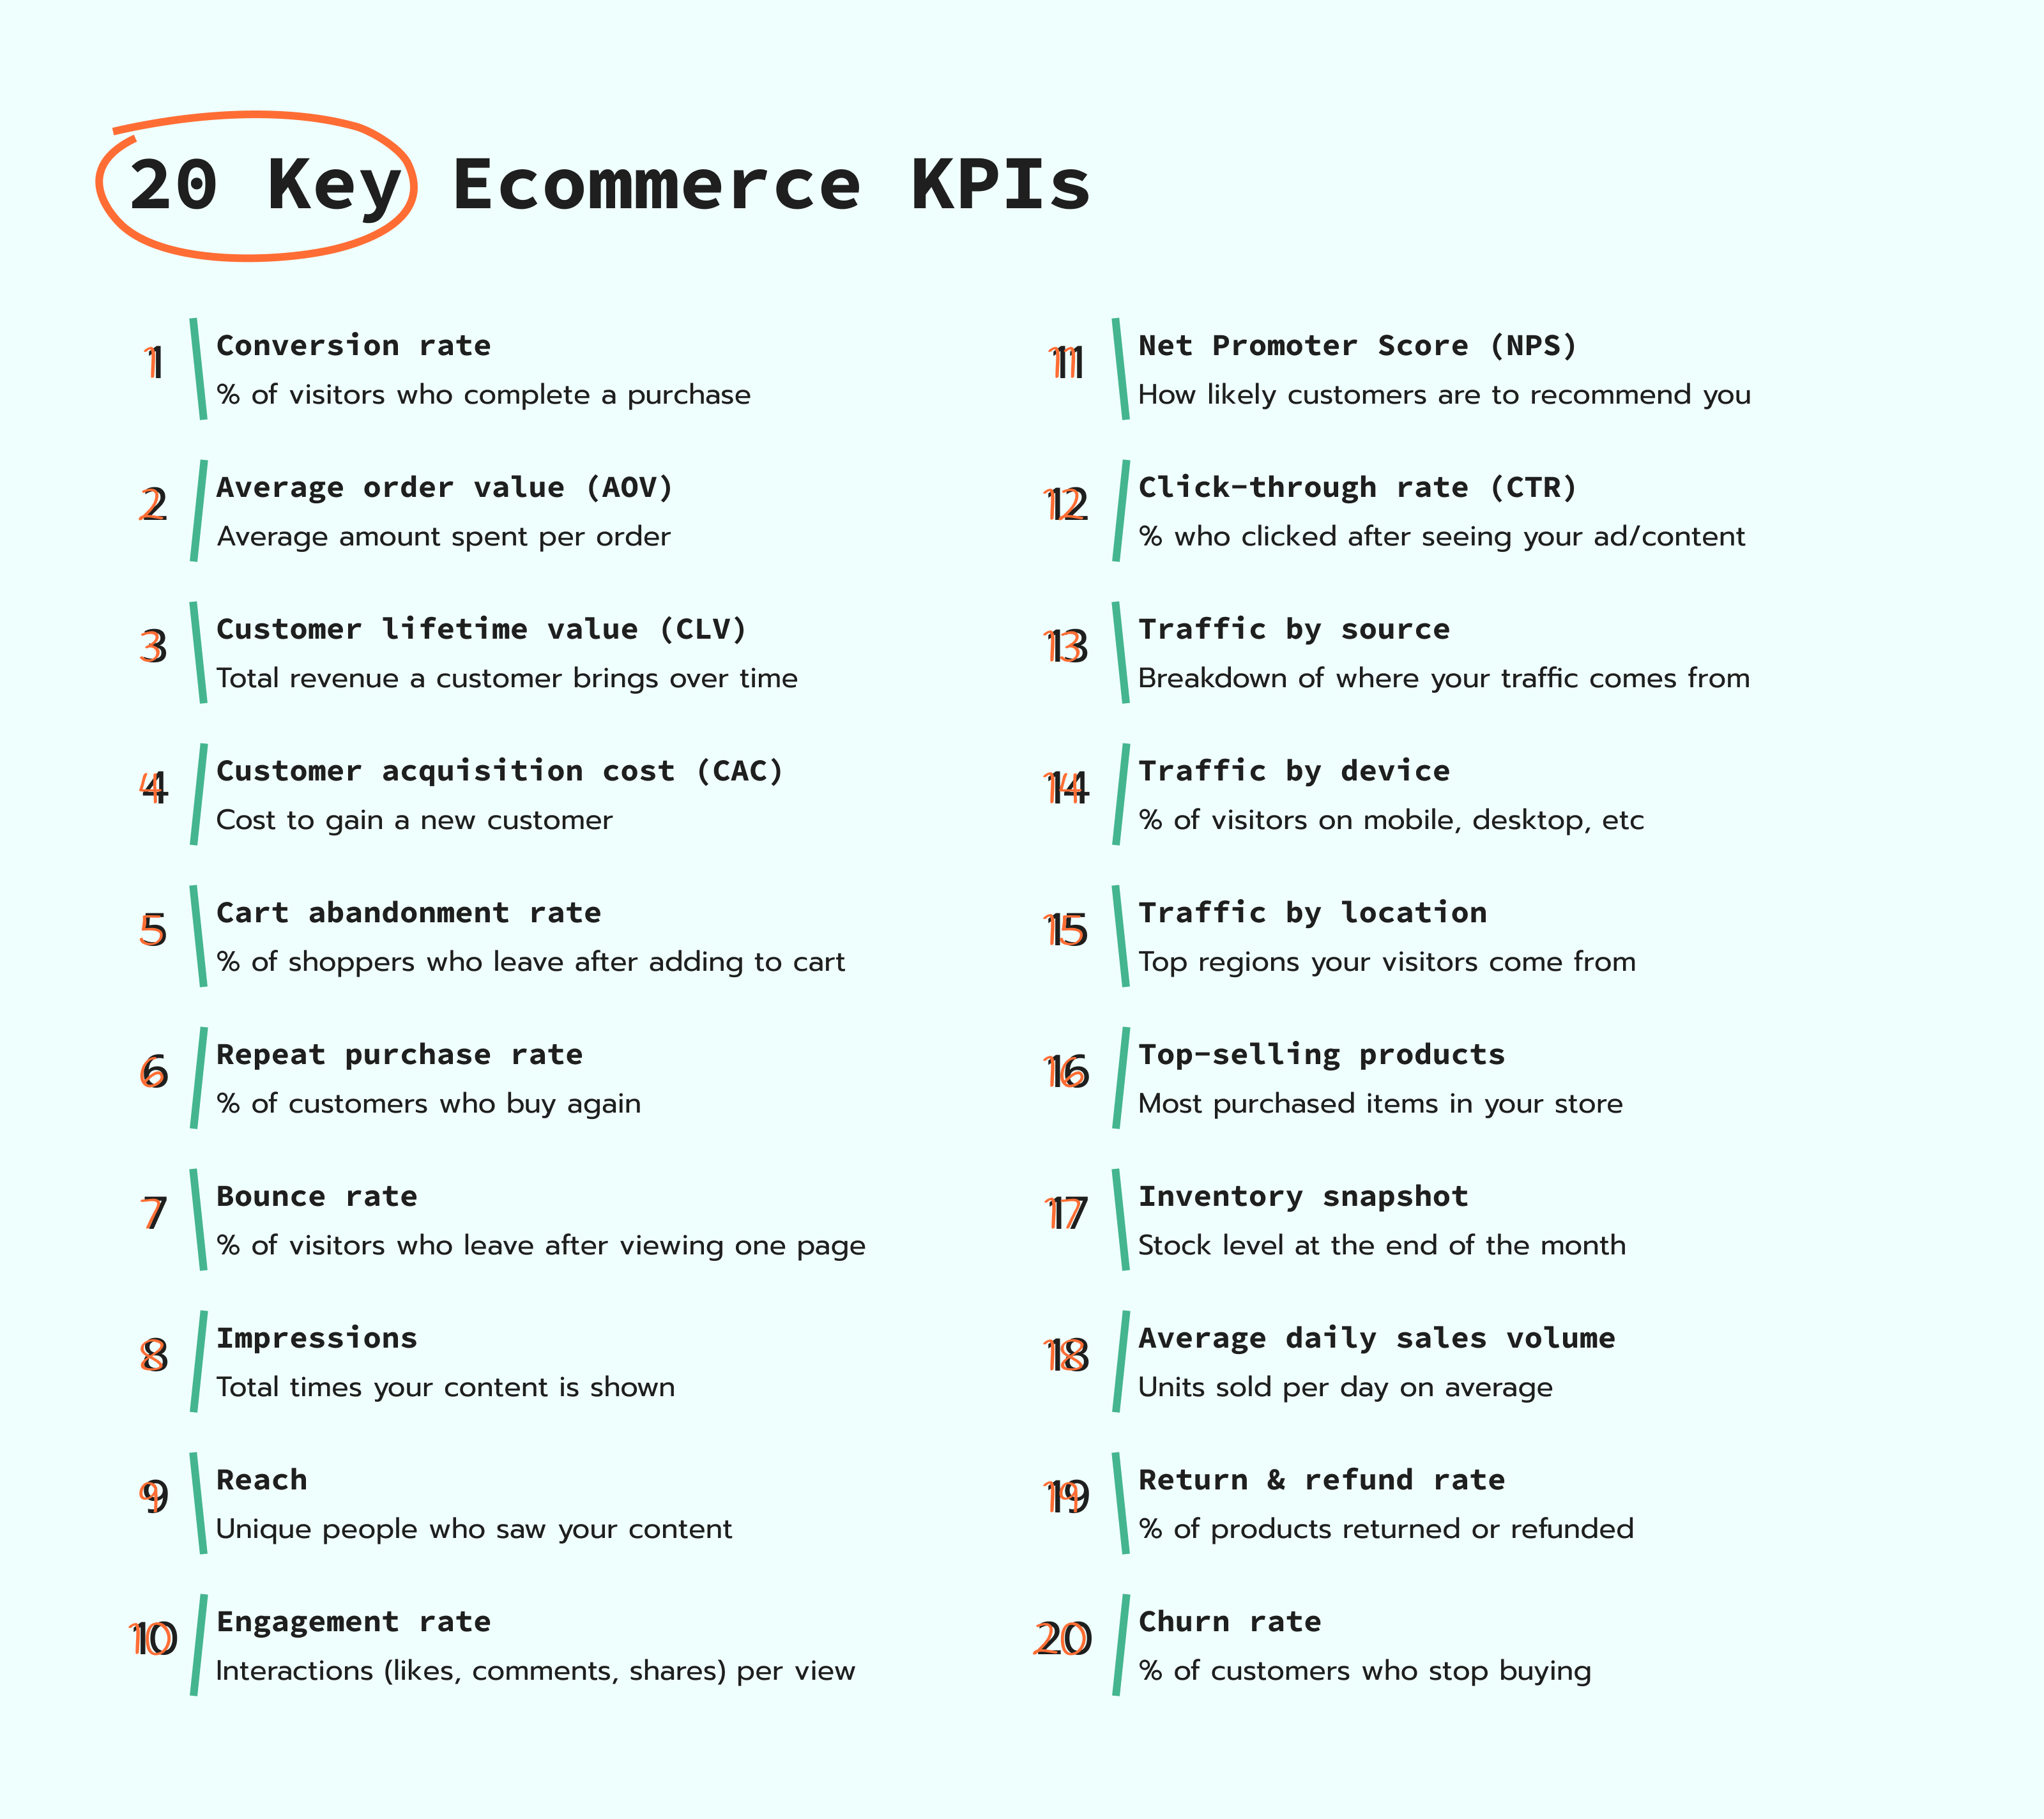
Here’s a more detailed look at each of these KPIs, by category:
Ad and content performance
1. Impressions.
How often is your content or ad seen? Suitable for brand awareness but needs context.
2. Reach.
How many unique people saw your ad or content? Unlike impressions, this avoids double-counting.
3. Click-through rate (CTR).
How many people clicked your ad or email link after seeing it? A must-track for paid campaigns.
4. Engagement rate.
How many people are interacting with your content, like clicks, shares, likes, and comments? It is a strong signal of relevance.
Website traffic quality
5. Bounce rate.
Are people leaving right after they land on your site? If yes, your landing pages may need help.
6. Traffic by source.
Where are your visitors coming from: Google, social, email, ads? This tells you what’s working.
7. Traffic by device.
Are more people shopping on mobile or desktop? Helps you prioritize your design and UX efforts.
8. Traffic by location.
Where are your customers physically located? Great for targeting and localization.
Financial and conversion KPIs
9. Conversion rate.
How many people who visit your store buy something? This tells you how well your store turns traffic into customers by measuring the number of customers who become paying customers.
10. Average order value (AOV).
How much do customers usually spend per order? Bigger AOV = more revenue per sale. The average amount spent per order is a key metric, as a bigger AOV = more revenue per sale and provides insight into customer spending behavior.
11. Customer acquisition cost (CAC).
How much do you spend to get a new customer? The lower, the better (as long as quality stays high). You can calculate CAC by dividing total acquisition costs by the number of customers acquired. See our lead acquisition guide for strategies on reducing the cost of bringing in new customers.
12. Top-selling products.
Which products are flying off the shelves? Helps with promotions, bundles, and inventory decisions by showing which items generate the most total revenue and how much revenue each product brings in.
13. Inventory snapshot (monthly).
How much stock do you have left at the end of the month? Useful for forecasting and cash flow. Calculating average inventory value helps benchmark inventory turnover and optimize inventory management.
14. Average daily sales volume.
How much inventory do you sell per day, on average? Helps you plan stock levels and avoid sellouts.
Customer Loyalty & Retention
15. Customer lifetime value (CLV).
How much is a customer worth over the long run? This helps you decide how much it’s worth to keep or win them back, especially when considering the value of existing customers and their impact on long-term profitability.
16. Repeat purchase rate.
How often do your customers come back for more? A solid indicator of brand loyalty.
17. Churn rate.
How many customers stop buying over time? Especially important for subscription or repeat-purchase models, and understanding churn among existing customers is key for long-term growth.
18. Net Promoter Score (NPS).
How likely are customers to recommend you to a friend? It’s a quick check of brand love (or hate).
Checkout experience and post-purchase
19. Cart abandonment rate.
How many people leave without buying after adding something to their cart? The e-shopping cart abandonment rate shows you the percentage of shoppers who add items to their cart but do not complete the purchase. It highlights the friction in your checkout process.
20. Return & refund rate.
How often are people sending stuff back? If it’s high, it could point to product or expectation issues. Monitoring this rate among existing customers can help improve retention and satisfaction.
Whether you're just starting or scaling fast, these are the top eCommerce KPIs every business should monitor to reach advanced eCommerce performance.
How to measure your eCommerce performance properly
| 1. Set your goals | Decide what you want to achieve (more sales, repeat customers, lower CAC, etc.). |
| 2. Pick your tools | Choose what you'll use to track data (GA4, Facebook Ads, your store’s analytics). |
| 3. Add tracking codes | Install all the tags and pixels on your website and checkout pages. |
| 4. Connect your tools | Link your data sources together (GA4, ad platforms, eCommerce system). |
| 5. Use server-side tracking | Set up server-side tracking (e.g. with Stape) to avoid blockers and track more accurately. |
| 6. Keep naming consistent | Name your campaigns and events the same way every time so your reports stay clean. |
| 7. Enrich your data | Add extra info like customer behavior or product details to get better insights. |
| 8. Test everything | Do a test purchase or conversion to make sure all tracking works. |
| 9. Collect your own data | Build a list of your customers (emails, purchases, etc.) instead of relying on third parties. |
| 10. Check your numbers often | Look at your main metrics every week or month to see how things are going. |
| 11. Fix problems fast | If data looks off or missing, fix your tracking setup right away |
| 12. Act on what you learn | Use your data to improve ads, your website, and how you sell. |
Accurate measurement is key. Calculating your KPIs for eCommerce depends on data, so marketing data enrichment is another essential thing to figure out.
How to improve the performance of the five main eСommerce KPIs in 2025?
Improving your top KPIs for eCommerce starts with small, consistent changes:
1. Conversion Rate.
Test different product images, descriptions, and checkout flows. Even a faster load time can make a big difference: even a 1-second delay can drop conversions. For a more technical edge, explore server-side testing conversion rate optimization outcomes to get cleaner data and more reliable A/B test results unaffected by ad blockers or browser restrictions.
2. Average Order Value (AOV).
Offer product bundles, “buy more, save more” deals, or free shipping above a certain order amount.
3. Customer Lifetime Value (CLV).
Build loyalty programs, send personalized offers, and follow up with customers after purchases to encourage repeat sales.
4. Customer Acquisition Cost (CAC).
Use better audience targeting, focus on organic channels like SEO and email marketing, and improve ad relevance to lower costs. Use CAPI to improve the quality of data you send to your ad platforms and reduce your cost per conversion.
5. Cart Abandonment Rate.
Add exit-intent popups with discounts, simplify checkout (fewer steps, more payment options), and send cart recovery emails.
Best for businesses focused on customer journey and retention. It is behavior-driven analytics tailored for lifetime value and churn tracking.
For better results from paid advertising, it’s essential to track key performance metrics consistently. This helps optimize PPC campaigns, improve targeting, and improve tracking precision.
FAQs
What are the best tools for tracking eCommerce KPIs?
Here’s a list of platforms fit for tracking eCommerce KPIs. All of them are user-friendly and relevant in 2025:
1. Google Analytics 4
Best for small to mid-size shops and startups. It is free, robust tracking of traffic, conversions, and user behavior with customizable dashboards.
2. Shopify Analytics
Best for Shopify-based stores. It has built-in, intuitive KPI dashboards for sales, customer behavior, and marketing performance.
3. Adobe Analytics
Best for large enterprises. It has advanced segmentation, forecasting, and integration with marketing suites.
4. Kissmetrics
Best for businesses focused on customer journey and retention. It is behavior-driven analytics tailored for lifetime value and churn tracking.
5. Looker Studio (formerly Data Studio)
Best for data-driven teams needing custom visualizations.It is a free, highly customizable tool that has dashboards via multiple data connectors.
6. Supermetrics
Best for SMBs and digital marketers. It automates KPI reporting by pulling data from various marketing sources into dashboards or spreadsheets.
7. Mixpanel
Best for product-oriented eCommerce platforms. It focuses on user actions with deep event tracking and funnel analysis.
8. Matomo
Best for privacy-conscious brands. It is an open-source solution that can be self-hosted, offers full data ownership, analytics, and compliance.
9. Databox
Best for quick, high-level KPI oversight. It easily connects to tools across the board, delivers mobile-ready dashboards, and alerts.
10. RJMetrics (now part of Magento BI)
Best for B2B/B2C businesses looking for advanced attribution. It is built on Magento, and it offers cohort analysis, funnel tracking, and marketing ROI insights.
How many KPIs do I need to analyze performance?
If you use too many, you risk being overwhelmed. If you use too few, you might miss the signals that matter most.
A sweet spot is 8 to 12 KPIs.
Reasons why that range makes sense today:
1. Clarity over quantity. A focused set of 8–12 KPIs keeps your dashboard actionable without stealing attention.
2. Critical coverage. This range lets you monitor traffic and acquisition, conversion and sales, customer health, marketing ROI, and operations without stretching yourself too thin.
3. Flexibility and adaptability. Around 10 metrics give you the flexibility to adjust, say, swapping in a new trend-driven KPI like product return rate, without rewriting your entire reporting logic.
Do eCommerce KPIs differ based on ad type or product niche?
Absolutely! In 2025, your eCommerce KPIs will shift depending on both the type of ads you run and your product niche. While every online store should keep an eye on core metrics like Conversion Rate, Customer Lifetime Value, and Return on Ad Spend, the secondary KPIs you track will depend heavily on where your traffic comes from and what you sell.
Most brands now use blended KPI dashboards. This means that your core KPIs stay consistent, but your supporting KPIs rotate based on:
- Which ad channels are active
- Seasonal campaigns
- Buying patterns in your specific niche
By tailoring KPIs this way, you’re not just tracking numbers, you’re tracking the correct numbers for the audience you’re paying to reach and the products you’re selling.

Comments