Jul 2, 2026
Server-side tracking doesn't stay fixed: how to maintain, monitor, and debug after launch
Written by
Manisha Mistry
Published Sep 2, 2026 comments
- Server-side tracking requires ongoing attention, as a successful implementation relies on a continuous, three-step loop of maintaining, monitoring, and debugging to ensure long-term data accuracy.
- Traditional validation methods are obsolete because client-side tools like Chrome extensions cannot validate server-side tracking once hits are routed through a custom server URL rather than third-party domains.
- Proactive maintenance occurs every six to eight weeks and involves manually auditing the setup using Google Tag Manager's preview mode to confirm that tags fire correctly, consent is respected, and no console errors exist.
- Continuous monitoring happens weekly and consists of reviewing Stape's incoming and outgoing logs for
4xxand5xxerrors, checking the domain score, and relying on automated alerts to catch sudden traffic drops or missing data. - Systematic debugging is used to isolate issues by following a strict four-step verification order that checks if the event fired on the web, arrived at the server, left the server, and landed on the end platform.
- Deep debugging relies on server logs, meaning that when an event passes all checks in GTM preview mode but still fails to record, Stape's server logs and Trace IDs are utilized to track the specific hit and verify its acceptance by the destination platform.
You spend a few weeks or months working directly with a client, where you transition them to server-side tracking and validate everything is running well. The client's happy, so they send you the final payment, you close the tab, move on to the next project.
Here's the thing though. Are you really done?
I believe setting up server-side tracking is part one. The other part is maintaining, monitoring, and debugging it after launch, so it keeps running well for your client and actually gets better over time.
I'm Manisha Mistry, the Technical Director at MeasureU. I teach people how to set up server-side tracking from scratch, all the way from taking a client-side container and moving the whole thing over to the server. I also implement server-side tracking for our own clients, and the part I harp on most is the part that comes after go-live, because that's where things actually go wrong.
So if you're a consultant, an agency owner, or the person who implemented server-side tracking for somebody else, this one is for you.
In this blog, I'll walk through:
- 1.Why validating server-side tracking is nothing like validating a client-side setup.
- 2.The three-step loop I run for every client: maintain, monitor, debug.
- 3.What to check, how often, and which Stape features do the work for you.
- 4.How to debug in order, and how to follow a single event through your server.
Let's dive in.
The client who thought their tracking broke
A few months ago, I moved a client, who had a highly technical team, over to server-side tracking. They knew their way around Google Tag Manager, how to set up tags, triggers, and variables, and they really loved going into DevTools.
Here is the thing, a few weeks after I transitioned them, their developers deployed a new version of the website, and it caused sheer panic because the old process they had always used to check their client-side tracking was telling them no events were firing to GA4.
They reached out with the concern that none of their GA4 events were firing. I was totally shocked, it was all working a few weeks earlier when I last checked their site. So I did what any consultant would do, I opened up preview mode on their server and web containers, walked through the site the way a user would, and watched every single event fire exactly the way it should.
This led to a really interesting discussion with the client on their validation process after a new site is deployed. I learned that they were using a Chrome extension that would display their GA4 events per page, and that extension works by watching the network for hits going to Google's third-party domain. That is exactly what stopped being true when I moved them over, because their GA4 hits were now going out on their own custom server container URL and obfuscated by Stape's Custom Loader, so the extension was looking for something that would never show up again.
So I worked with their team to build a new validation process, something they could run themselves after every deployment to confirm their server-side tracking was still healthy. That is where the maintain, monitor, and debug process came from, first from documenting how I validated and debugged my own setups, and then from working directly with that client to train their team to do the same.
The loop: maintain, monitor, debug
In my opinion, server-side tracking is pretty resilient, and it is still where I recommend most clients go, especially the ones spending real money on ads. That said, it is not a set it and forget it setup, and keeping it healthy takes an actual process, where you are actively maintaining it, monitoring it, and every so often debugging it when something doesn't look right.
It took me a long time to realize I had already been running these three steps for years, for my clients and for our own server-side tracking, I had just never documented it.
So now is the time to put my process in writing, and to start, here is the loop…
- Maintain is you going in on purpose to check the setup is still right.
- Monitor is Stape watching in the background to tell you the traffic is still flowing.
- Debug is what you do when one of those two turns up something that isn't working.
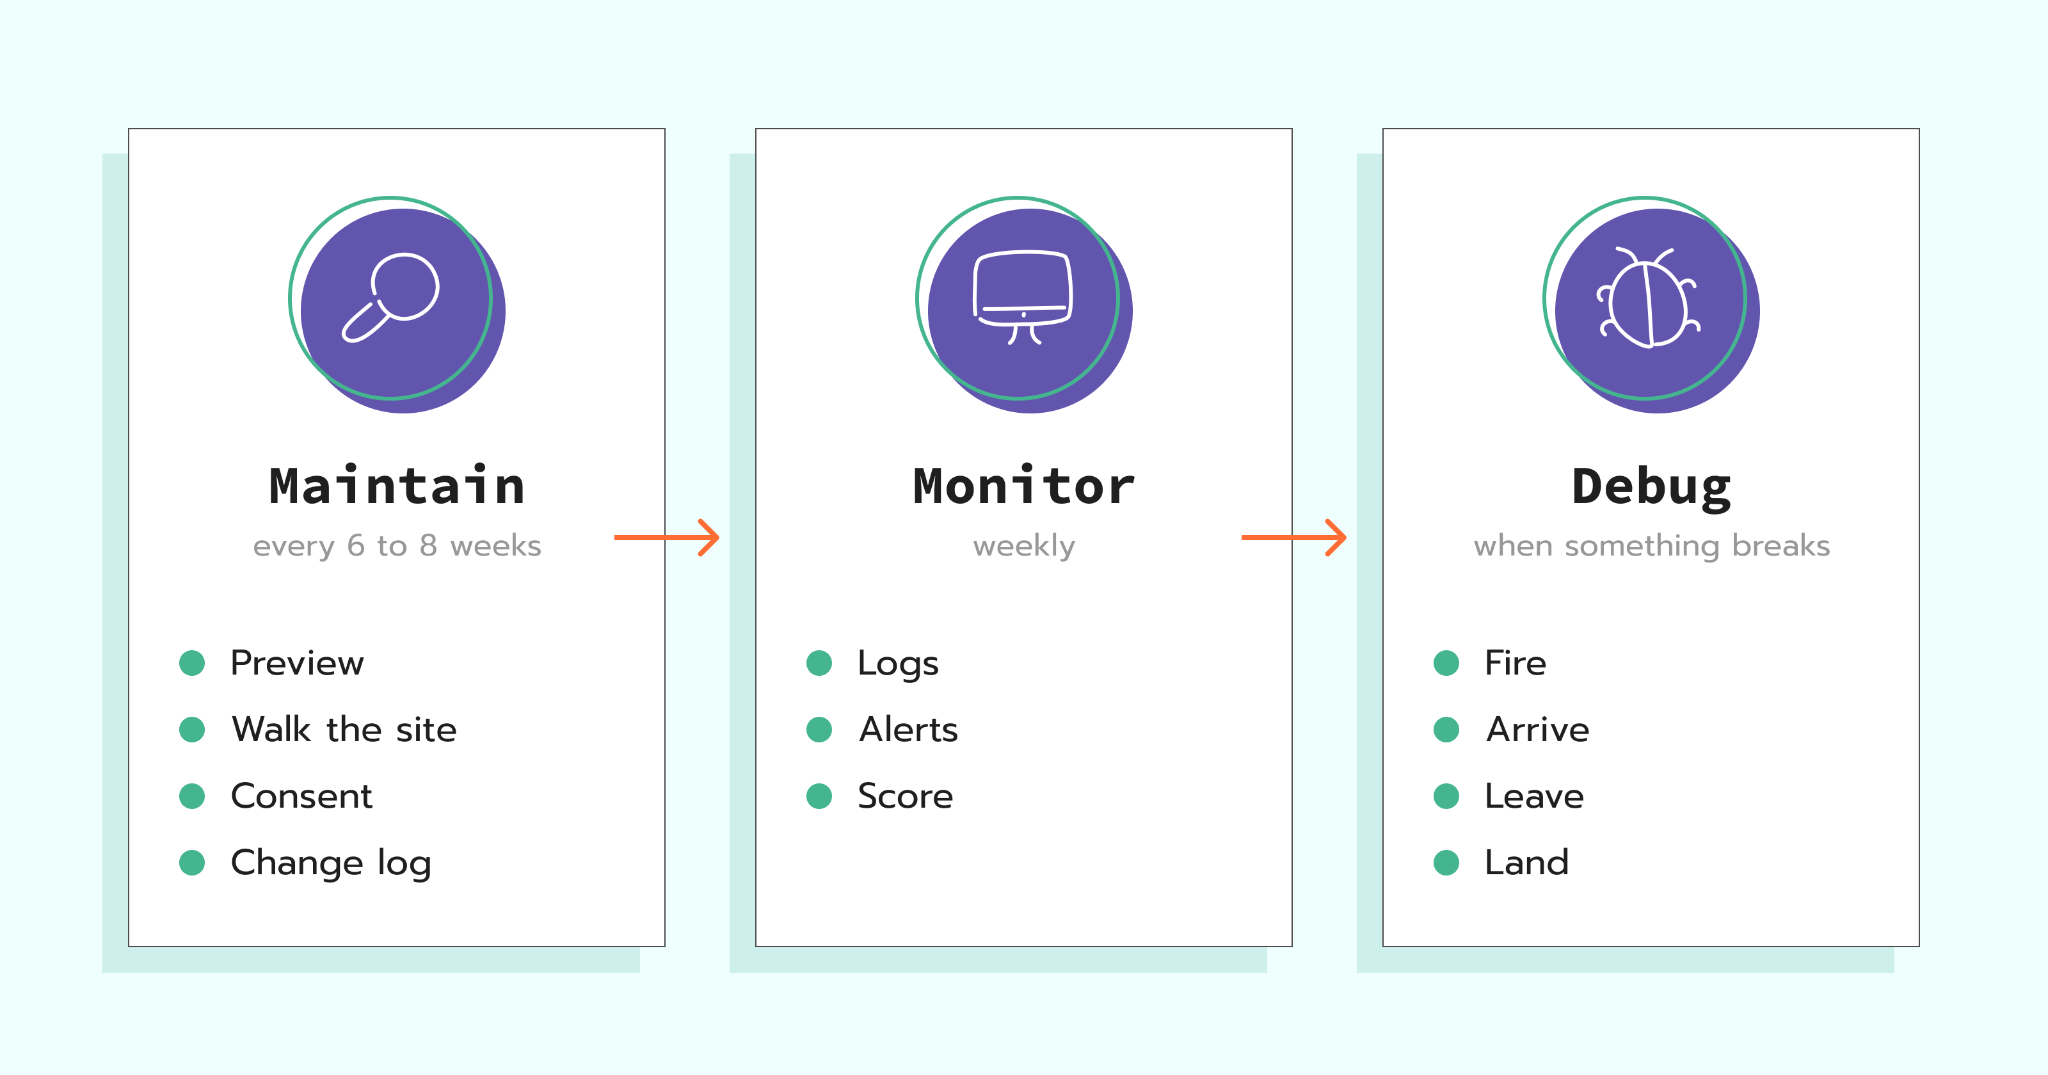
Now it is important to know this is not a checklist, instead each step is designed to own a part of the maintenance process, and some steps you do often, while others you only do when you need to.
Let's go through each one together.
1. Maintain – is the setup still right?
I like to think of maintain as the proactive part, instead of sitting back waiting for a client call or an alert, you actively check if everything is working well.
Process
Every 6 to 8 weeks, pop into the client's GTM, preview your server and web containers, walk through the site, and as you go, check:
- What is firing?
- What is not firing?
- Are there any console errors?
- Is consent being followed properly?
- Are Meta and Google Ads tags still firing?
Why do the check?
You would be surprised to know that most times this is how I catch that something is broken on my client's site. Once I caught that a client's lead forms had stopped working before they did, and another time I figured out their post-purchase thank-you page was missing from a deployment the web team had done a few hours earlier. When you reach out to the client with these types of findings, you look like a superstar, and that is one more reason for them to keep you around.
Finally, another part of maintenance is all about good change documentation, and trust me, I am not good at documenting my GTM changes. That said, this is where AI can help, and something I covered in my July article, AI that actually helps with measurement: Stape's AI Assistant and three free MCP servers, was using Stape's GTM MCP server to capture changes post-publish and have them stored in a change log in Google Sheets. It has been one of the best AI measurement use cases for me, and I have the best documentation of my GTM changes now, which also looks amazing to my clients.
2. Monitor – is the traffic still flowing?
I like to think of monitoring as the part that runs in the background, and I just dive in to take a look around. On Stape, monitoring is easier than Google Cloud, as Stape handles the logging for you and you can set up alerts pretty quickly. Before we dive into the process, it is important to know that you will use the same logs in Stape for monitoring and debugging, the difference is how you use them. Monitoring is all about looking at the logs, whereas debugging is about using them to resolve an issue.
Process
The process for monitoring has three key steps, two that I have done for a while now and a third that I just added as Stape added some new functionality that can help with monitoring.
There you have it, the three steps for monitoring. Next up is what happens when maintaining or monitoring turns up something that looks off, and you have to go and find out why (always fun…right?).
3. Debug – why isn't it working?
If you have implemented server-side tracking, or any tracking, you have been here (come on, I know I have been here). Something is not working, and it is on you to figure out what is broken and fix it. Over my years working with my clients and teaching server-side tracking, I have developed a system for when it comes to debugging that has helped, and today I am going to share it with you.
In my opinion, when it comes to debugging, before you hop into the logs and start scrolling, start in the place where you can see everything fire, follow a tag from the web container to the server container and see the actual data, that is none other than GTM Preview Mode! :)
Here is what I recommend: hop on GTM preview mode for your server container and then for your web container, load up the site and walk through it. As each event fires, run it through 4 questions in the order below:
Note: you only need to check the events you are actually worried about, so if GA4 is the problem and Meta is fine, run the GA4 events through the four questions and leave the rest alone.
| Questions | Live check |
|---|---|
| Did it fire? | Web container preview / Tag Assistant |
| Did it arrive? | Server container preview |
| Did it leave? | Server container preview |
| Did it land? | GA4 DebugView, Meta Test Events |
It is important to know that I go in this order every time, as the first question that fails is the one that tells me where the problem actually lives. If it never fired, the problem is client-side, so it is the web container or a consent setup issue. If it fired but never arrived on the server, I then start looking into the web and server container connection and the actual server tags and triggers. That saves me from spending an afternoon digging through the server container when the tag was never firing in the first place.
Now, one thing that happens sometimes to me is everything checks out in preview mode, it all fires just fine, but still there is a bug. This is now where the logs come in. If everything fires just fine, the next action is to see what the logs received, so now we add another column to the table, which is Check after preview.
| Questions | Live check | Check after preview |
|---|---|---|
| Did it fire? | Web container preview / Tag Assistant | N/A |
| Did it arrive? | Server container preview | Incoming log |
| Did it leave? | Server container preview | Outgoing log |
| Did it land? | GA4 DebugView, Meta Test Events | GA4 reports, Events Manager |
The whole goal of the Check after preview is that once you validate everything is firing, you need to validate if the information makes it to the server (incoming logs), leaves the server (outgoing logs), and finally makes it to the end platform.
Now, I would be doing you an injustice if I didn't tell you that sometimes, on rare occasions, you need to follow the incoming logs all the way through to the outgoing logs using something called Trace ID.
Before I get into it, I will say it is not fun and not something I have had to do more than a handful of times.
That said, Stape does make the process a lot easier, as when you open up any incoming log by clicking on the arrow on the right for any row:
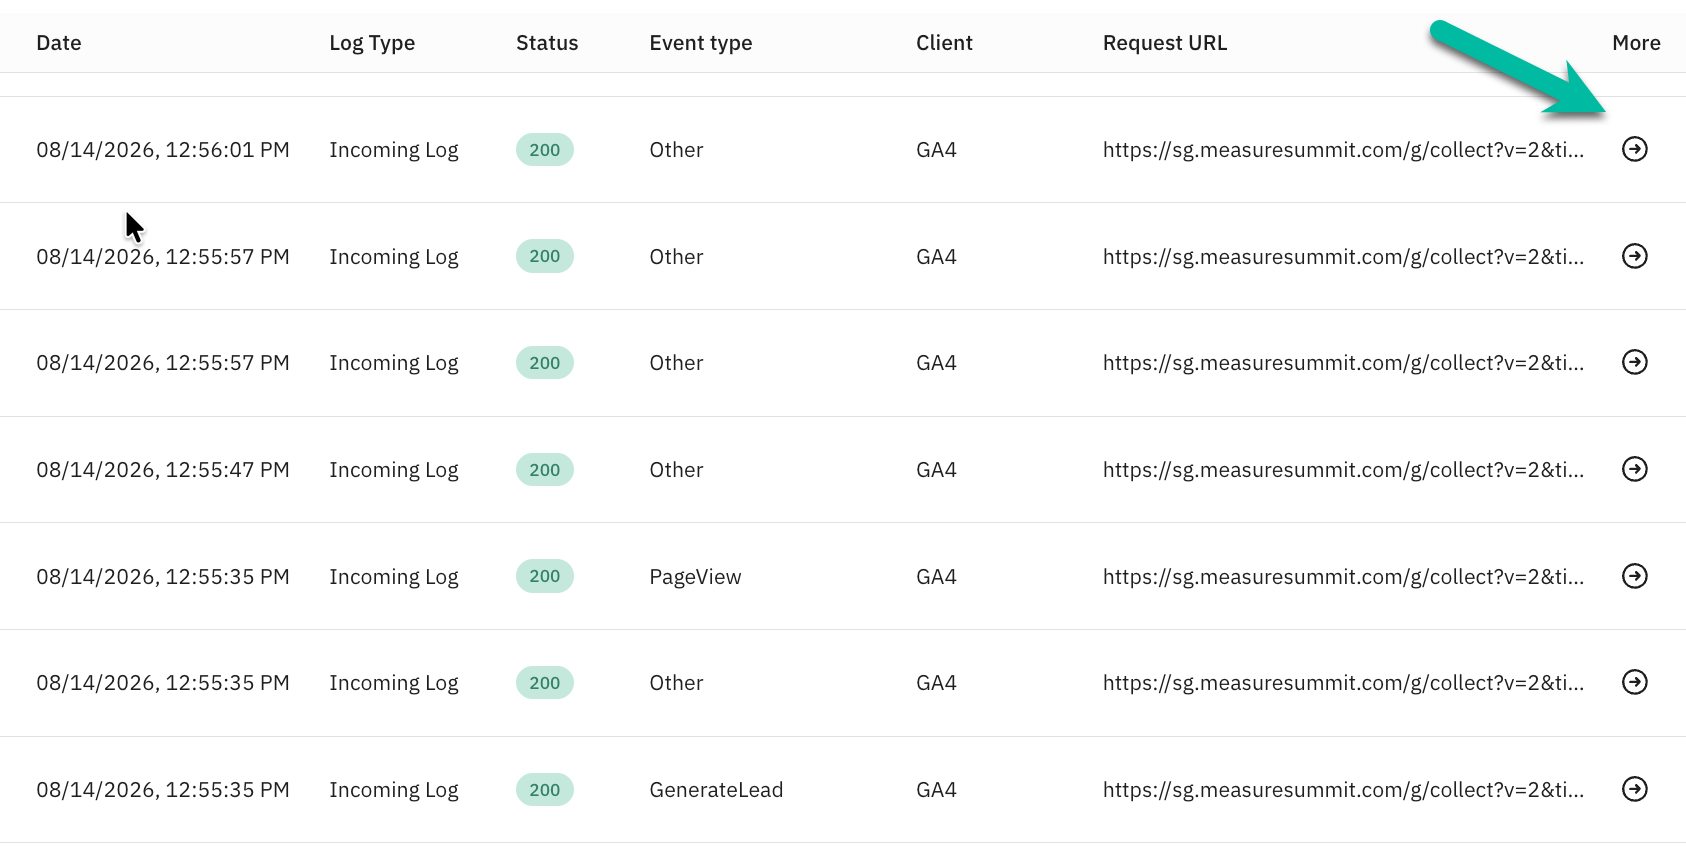
You can view the actual incoming log contents, but below it, see the corresponding outgoing log.
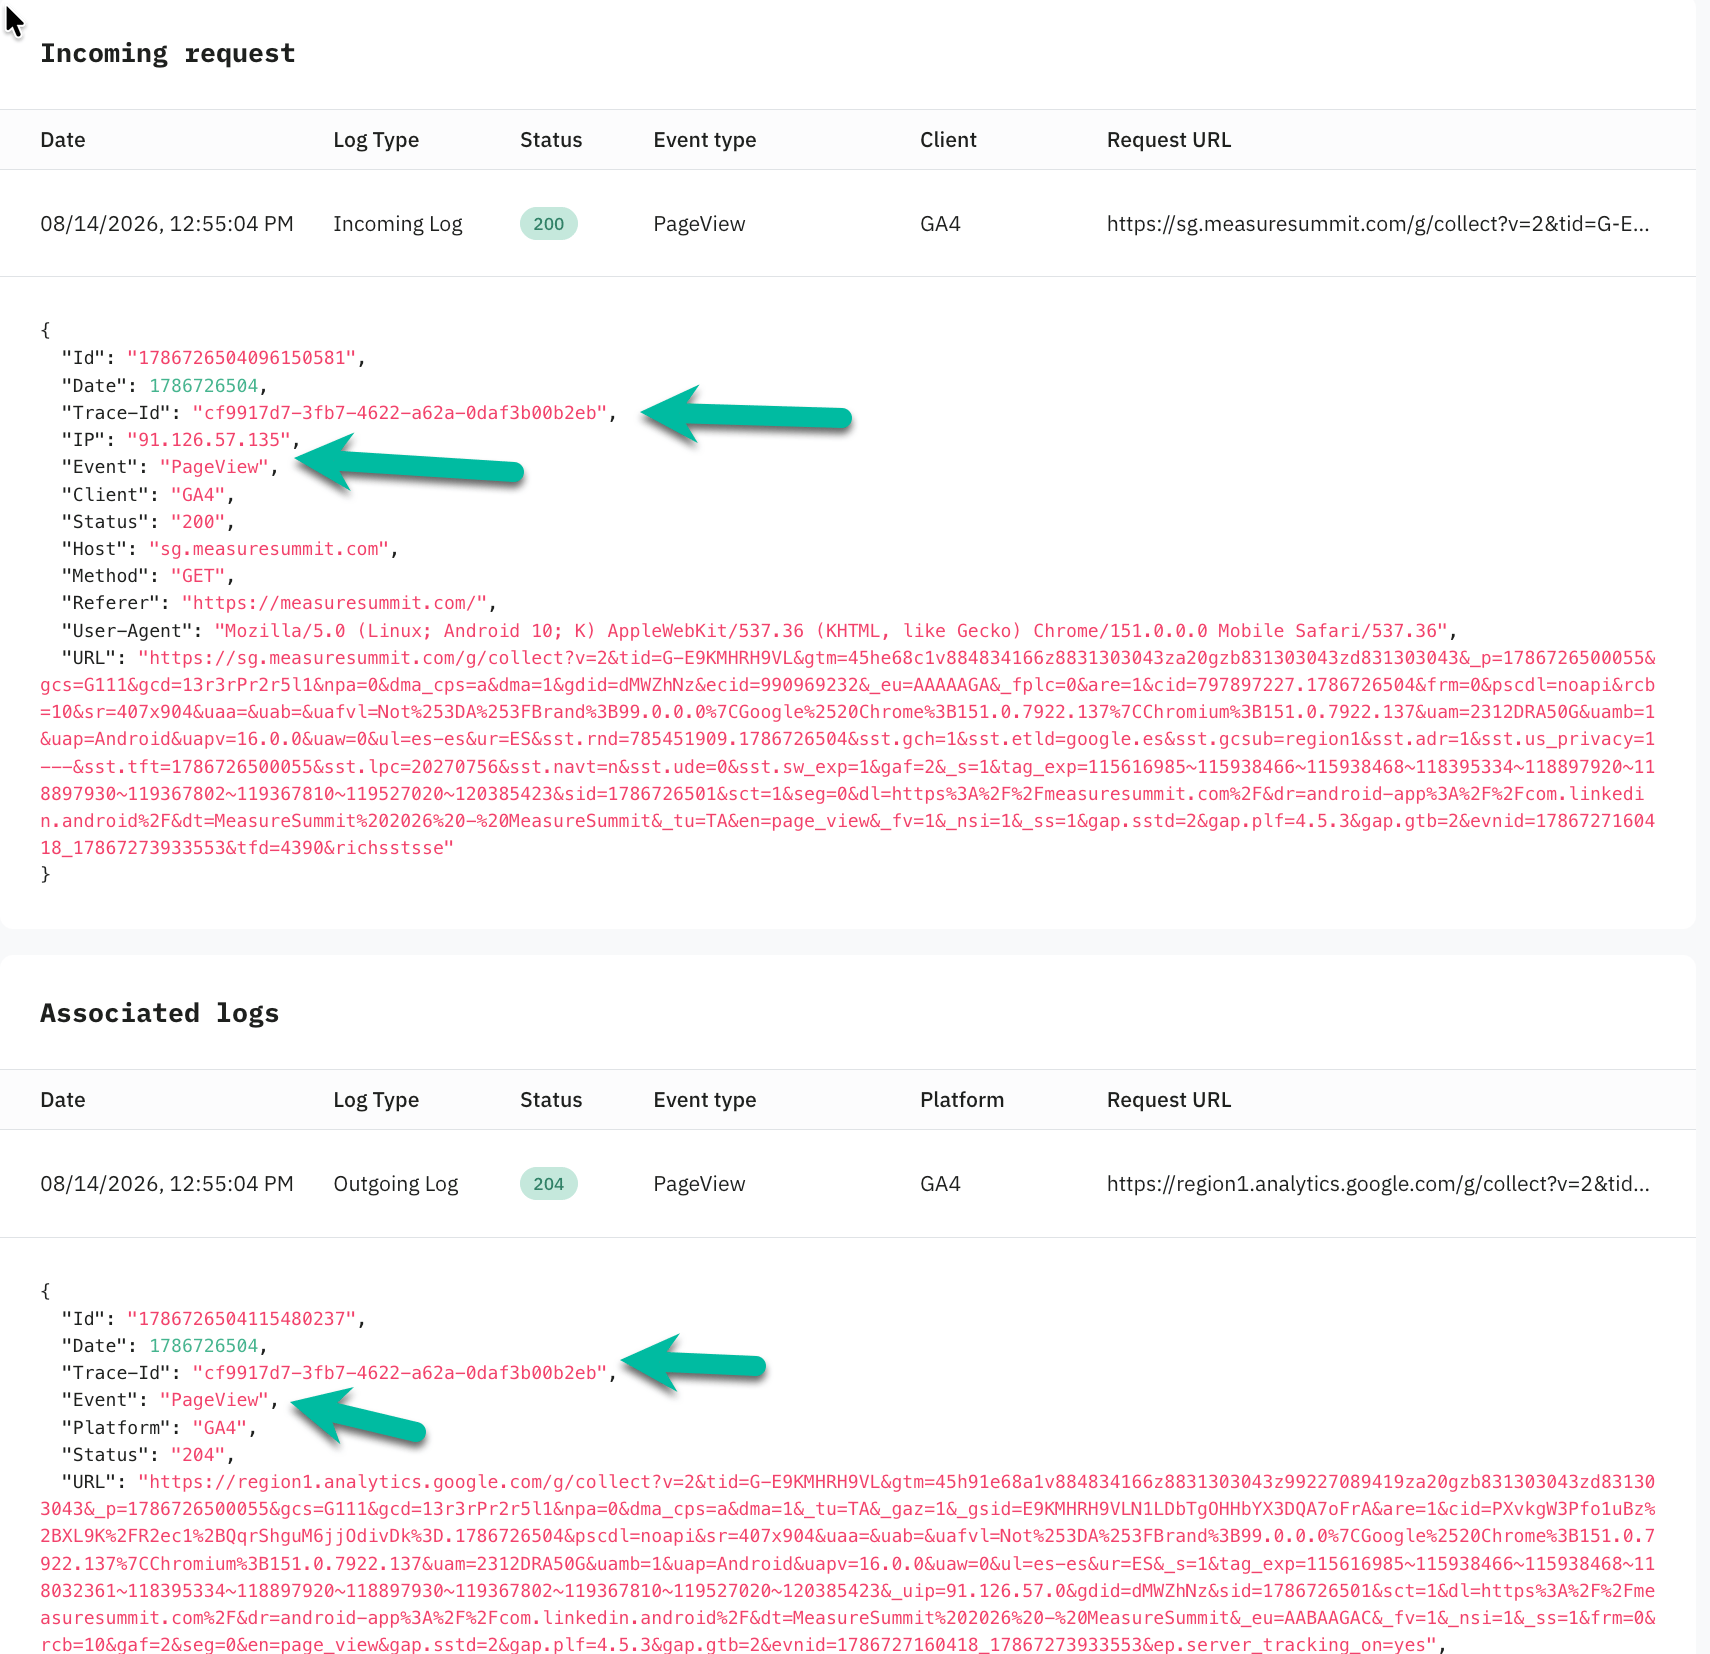
In the image above, you can see the Trace-Id and the event match, so that tells you the server received that incoming GA4 request, sent it off to GA4, and got a 204 back, which means the hit was delivered, but it does not tell you the event was counted. To confirm that, you have to go back to the last of the four questions and check in GA4 itself, which is exactly why “did it land” is the final step and why I always finish in GA4 DebugView or the reports.
Finally, if you happen to be one of the lucky ones using Stape's Enterprise or Custom plan, you can export your logs automatically to a GCP or AWS bucket and use AI to help complete this analysis.
Wrapping up
So let's think back to the question I asked earlier, are you really done with server-side tracking once the setup is complete?
I am guessing you know my answer is…nope. Server-side tracking is resilient, and it is still the right move for most clients spending real money on ads, but it is not set-it-and-forget-it, instead you need to check in on it from time to time.
That is all this process is:
- Maintain every 6 to 8 weeks, hop into preview, go through the site, and check that everything is firing.
- Monitor weekly, scan your incoming and outgoing logs, keep a couple of alerts running, and glance at your score.
- Debug in order, fire, arrive, leave, land, because the first question that fails tells you where to start looking.
Transitioning to server-side is a project, but maintaining, monitoring, and debugging it to keep it running well is an ongoing process that you can do for your clients.
Want to start on the server side?
Try for freeRecommended for you
Oct 1, 2026
Dec 22, 2025
Blog
AI that actually helps with measurement: Stape's AI Assistant and three free MCP servers
Stape's free MCP servers and AI Assistant bring AI into GTM, GA4, and server-side tracking. Here's what each tool does and when to reach for it.
Jul 23, 2026

Comments