Logs overview
Updated Jul 13, 2026
The Logs feature gives you real-time and historical records of the data flowing in and out of your server-side Google Tag Manager (sGTM) container. It makes it easy to monitor and troubleshoot your tracking setup, so you can quickly spot why a tag isn't firing, or if there are some server errors.
The Logs feature is available only on paid plans. How long your logs are kept depends on your plan:
- Pro / Pro+ – keeps the last 3 days of logs.
- Business / Business+ – keeps the last 10 days of logs.
- Enterprise / Enterprise + – keeps the last 10 days of logs and supports log export.
The Export logs feature is available for Enterprise plans or higher.
How to find Logs
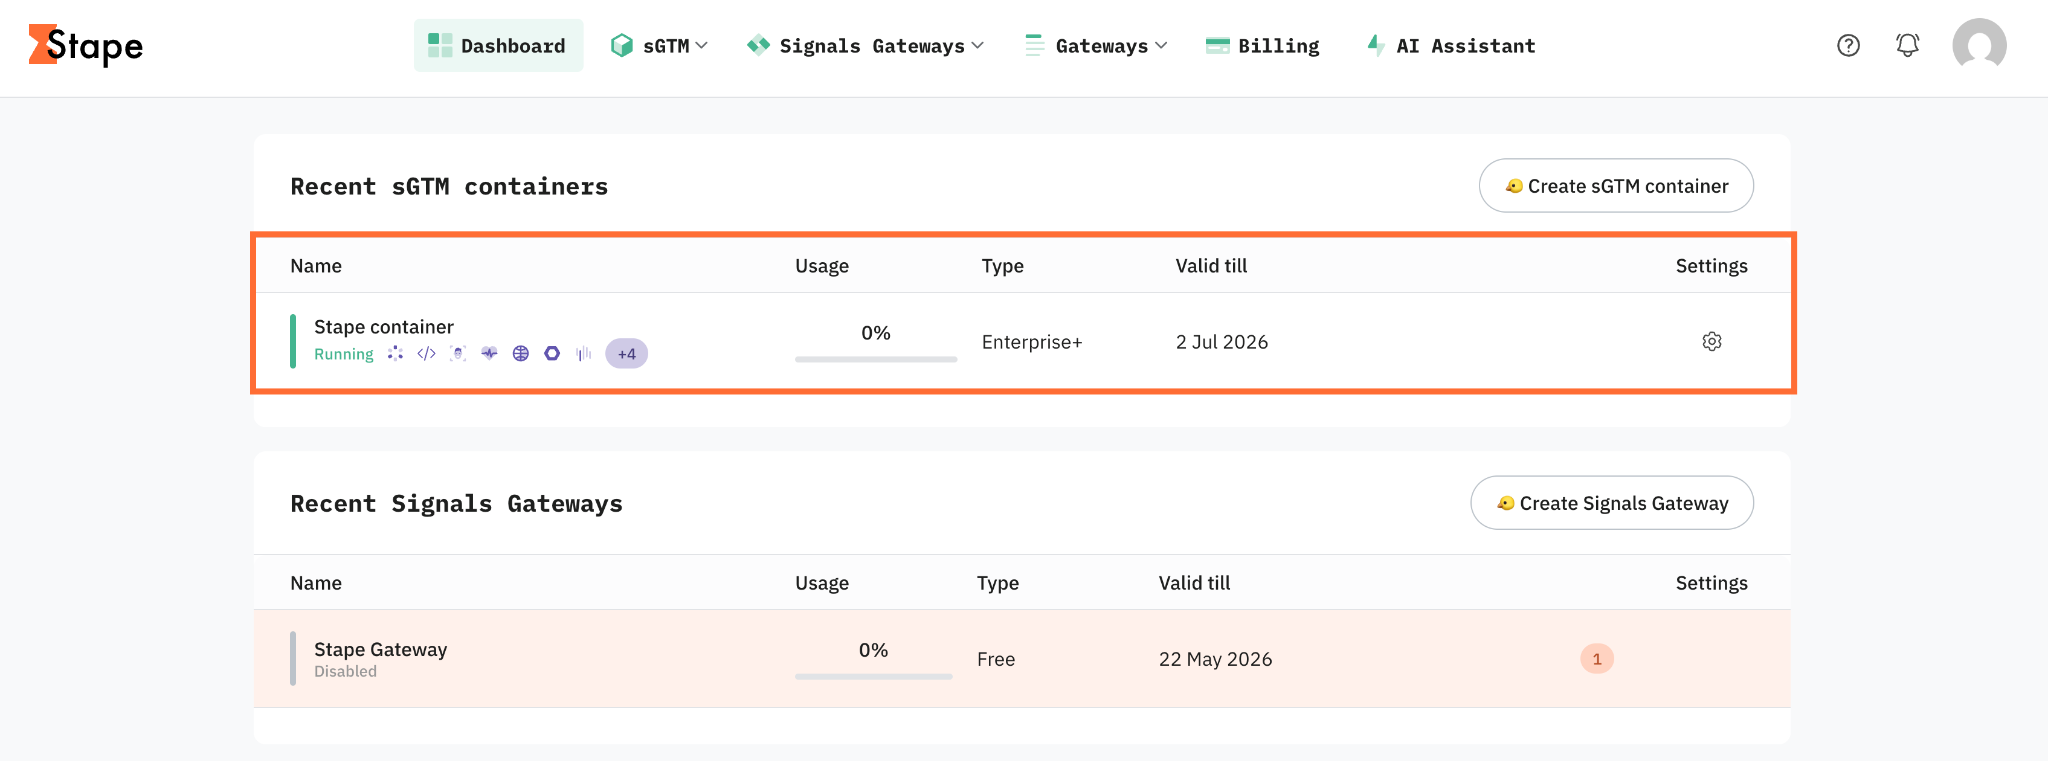
1. Log in to your Stape account and select your sGTM container from the dashboard.
2. Click on the Logs tab.
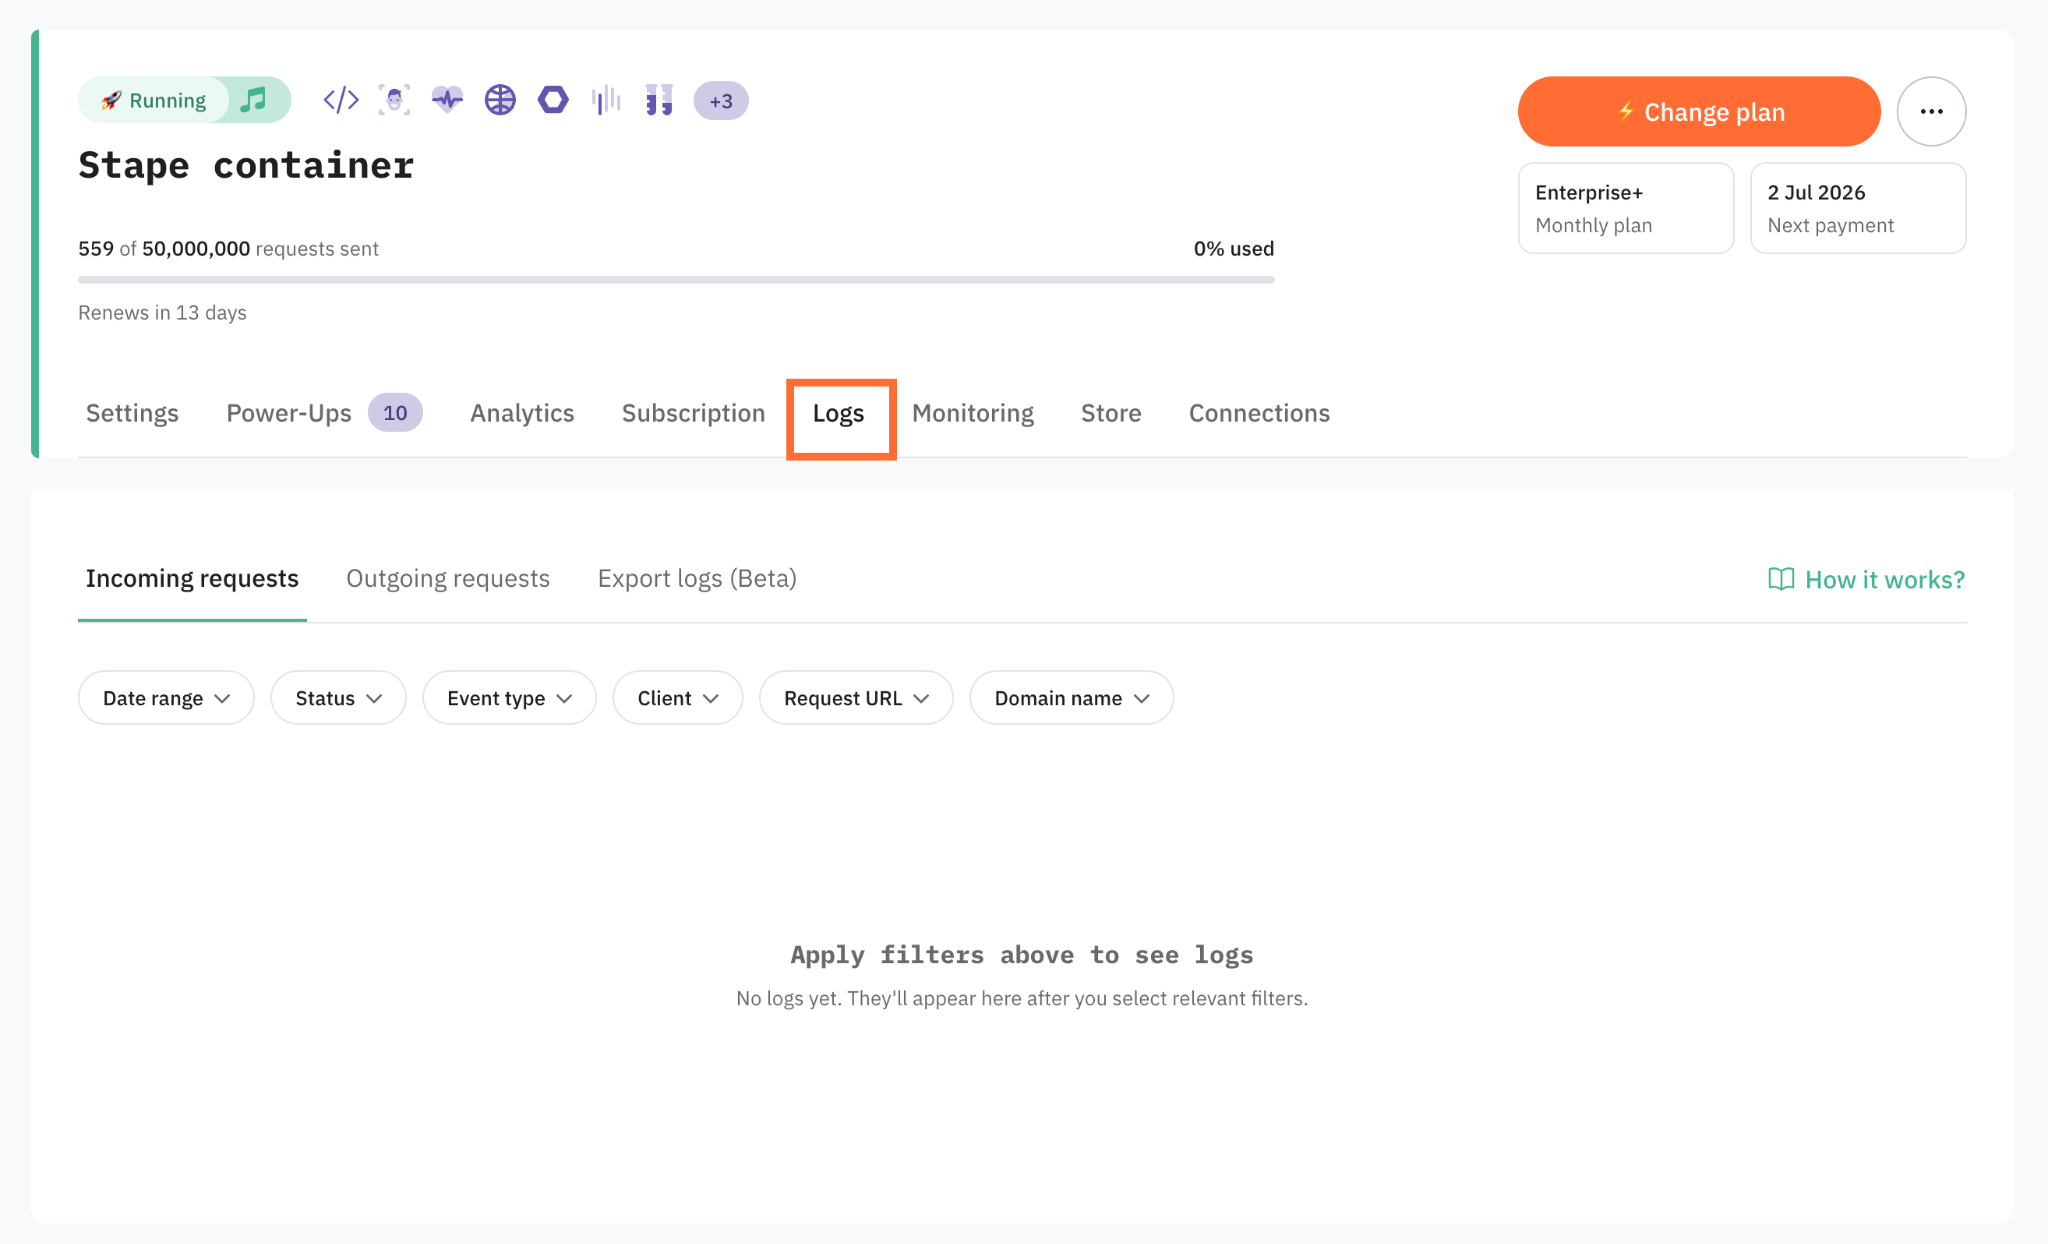
3. Perform a few actions on your website, such as opening a page, clicking a button, or adding a product to the cart. This will send test events to Logs, so you can check how your tracking works.
Dashboard
Incoming requests
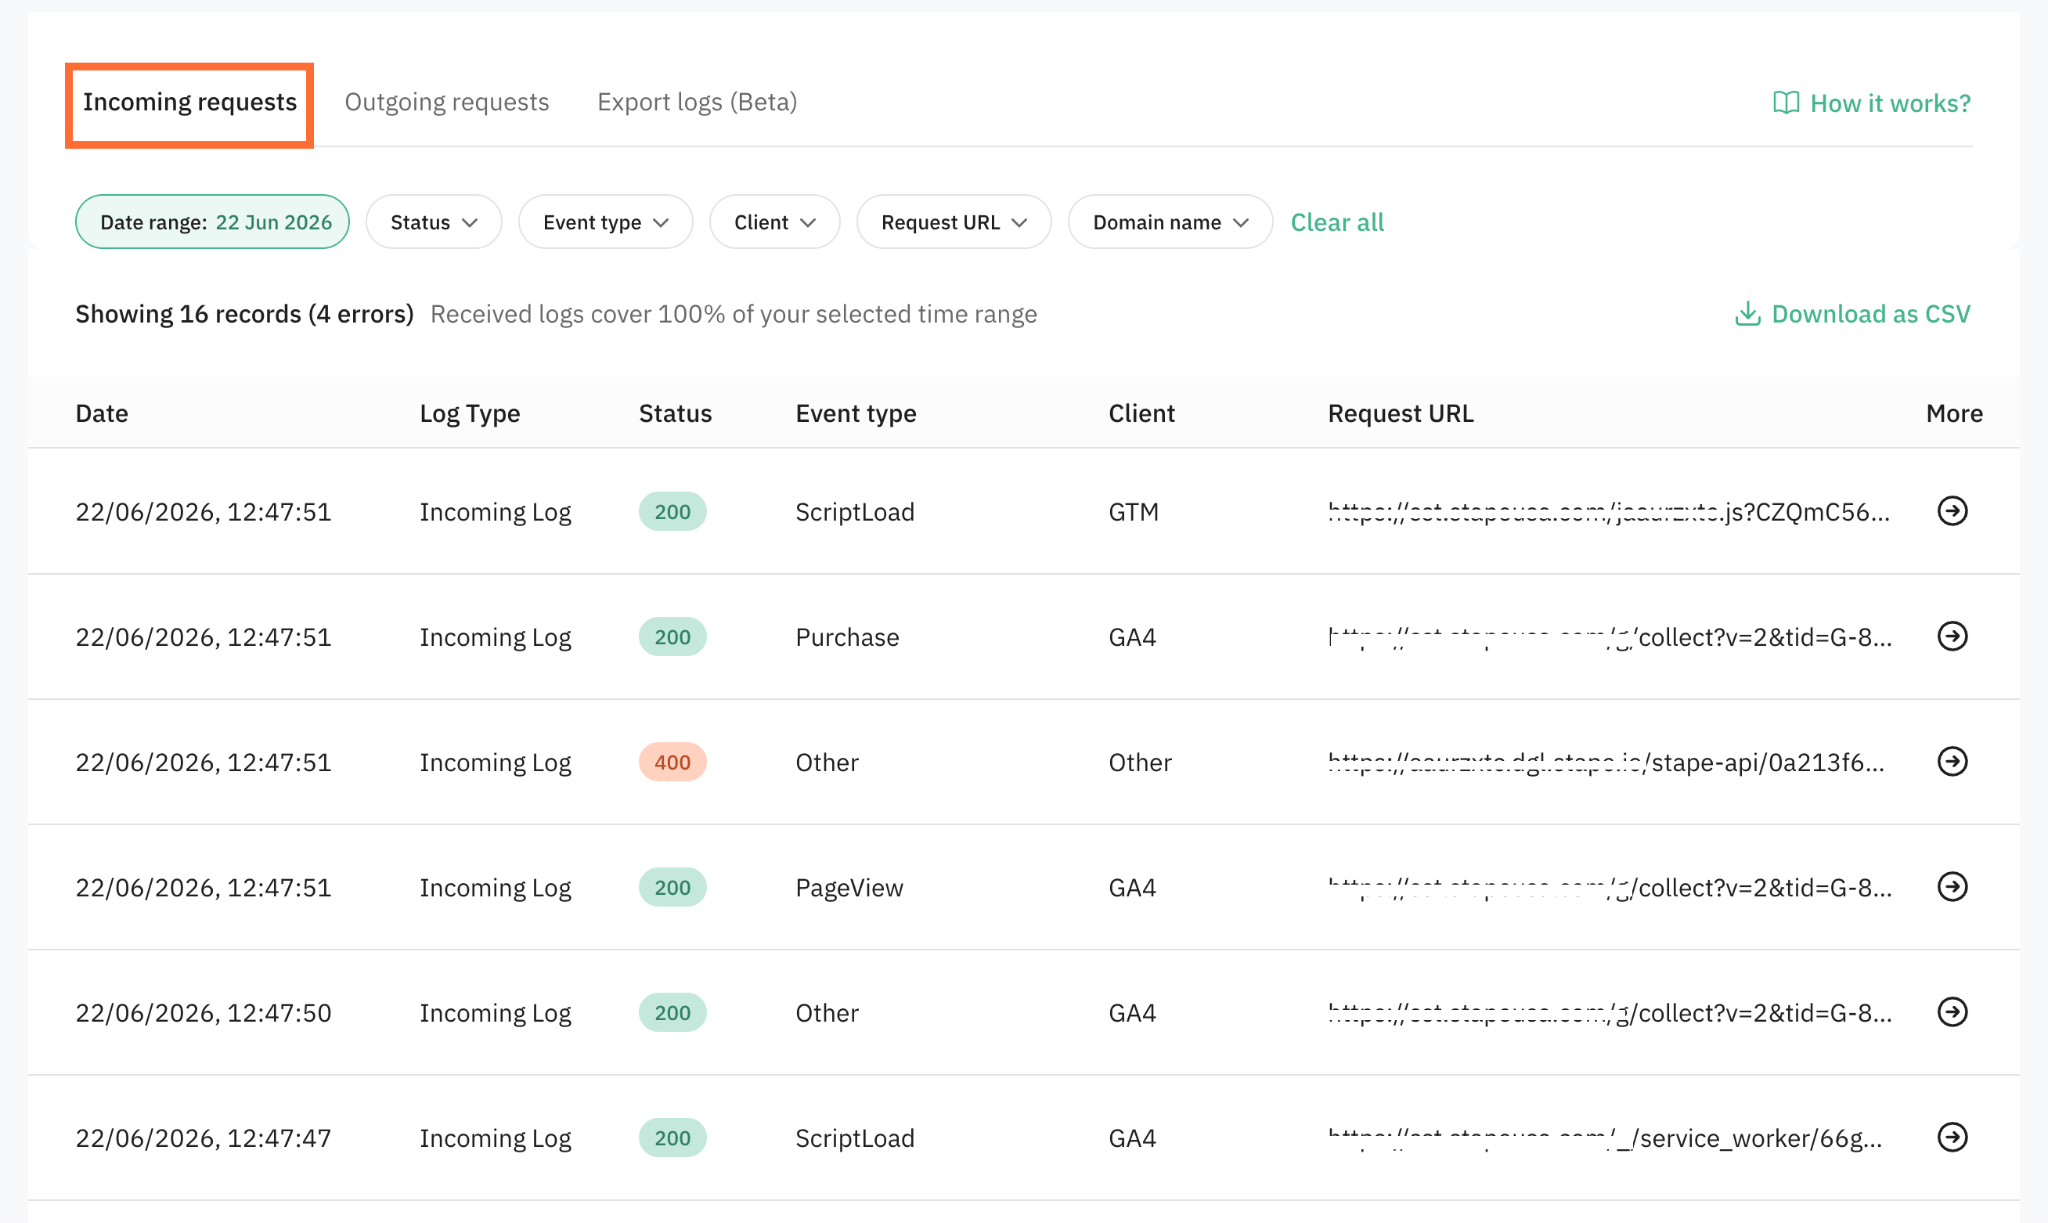
Here you can find requests received by your sGTM container (for example, from your website, GA4 tags, or the Data Tag). These logs don’t contain cookies or personally identifiable information (PII).
To see the logs, you can apply the following filters:
- Date range – select a specific timeframe to view your logs.
- Status – the response status code. For the detailed explanation read the Status codes chapter.
- Event type – Stape automatically classifies your incoming sGTM requests into standardized categories. You can read about each specific event in Google documentation.
- Client – platform type that sent the data (for example, GA4, GTM, Data client, etc.). For the detailed client breakdown see the Clients chapter.
- Request URL – the full web address of an HTTP transaction, including its path and query parameters. This filter helps you isolate specific endpoints (such as distinguishing between GA4 and Data Client streams) or verify that certain parameters, like event IDs or traffic sources, are included in the request payload.
- Domain name – the tagging server URLs of your container. If you route tracking data from multiple web properties or country-specific domains (e.g.,
ss.domain.co.ukandss.domain.de) into a single sGTM container, you can easily isolate and audit traffic coming from one specific domain. Also, when transitioning your website setup to your new subdomain, you can filter by each domain to confirm that traffic has successfully migrated and that the default domain is no longer receiving requests.
After applying all of the filters, the logs will appear on the dashboard. Click Download as CSV to download the data.
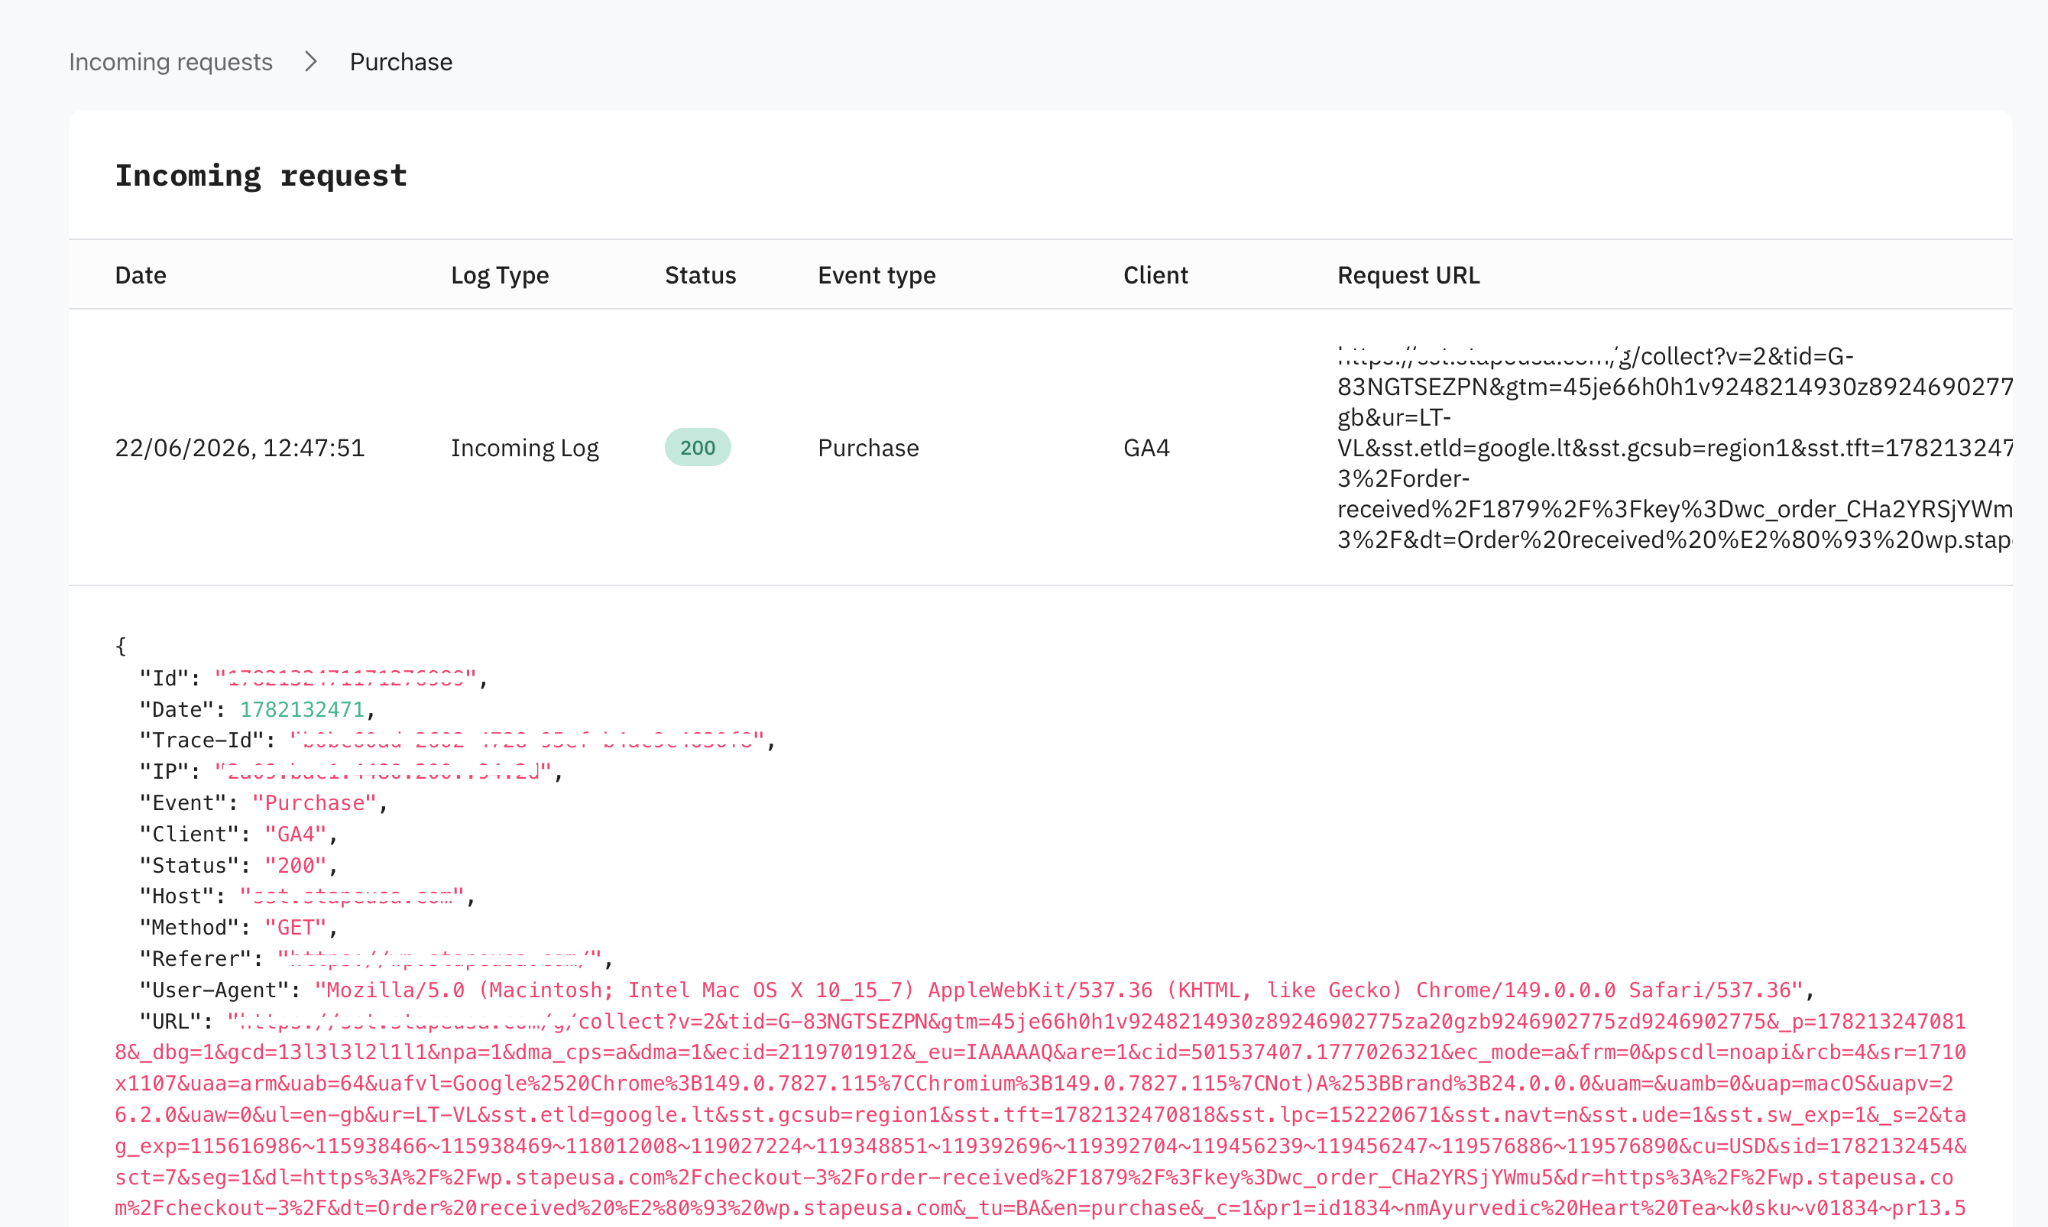
To view full log details, click the More icon. This page provides a comprehensive breakdown of the incoming HTTP request, including its full JSON metadata. If any outgoing requests were triggered by this incoming request, they’re displayed as JSON blocks under Associated Logs. This page is a debugging tool for verifying data payloads, tracing request paths, and diagnosing potential issues in your server-side tracking setup.
Clients
The Clients section helps you identify the origin of your incoming server-side requests in Stape.
Here’s a quick explanation to each client type available for filtering and analysis:
- GA (Google Analytics) – standard Google Analytics requests. These are parsed from paths like
/g/collector/collectinto structured event data. - GTM (Google Tag Manager) – requests originating from your web container, including preview sessions.
- Data (Data Client) – manages incoming custom payloads from Stape’s Data Tag.
- Anonymize – handles requests processed by the Stape Anonymizer power-up, which hashes or strips sensitive identifiers (like IP addresses) to support data compliance.
- JS – manages requests for static JavaScript files (e.g.,
gtm.jsorgtag.js) served through your custom domain to help bypass tracking protections. - Other – captures requests from custom, third-party, or manual client templates that don't fall into the categories above (e.g., Facebook Conversions API, TikTok Events API, or custom webhooks).
Outgoing requests
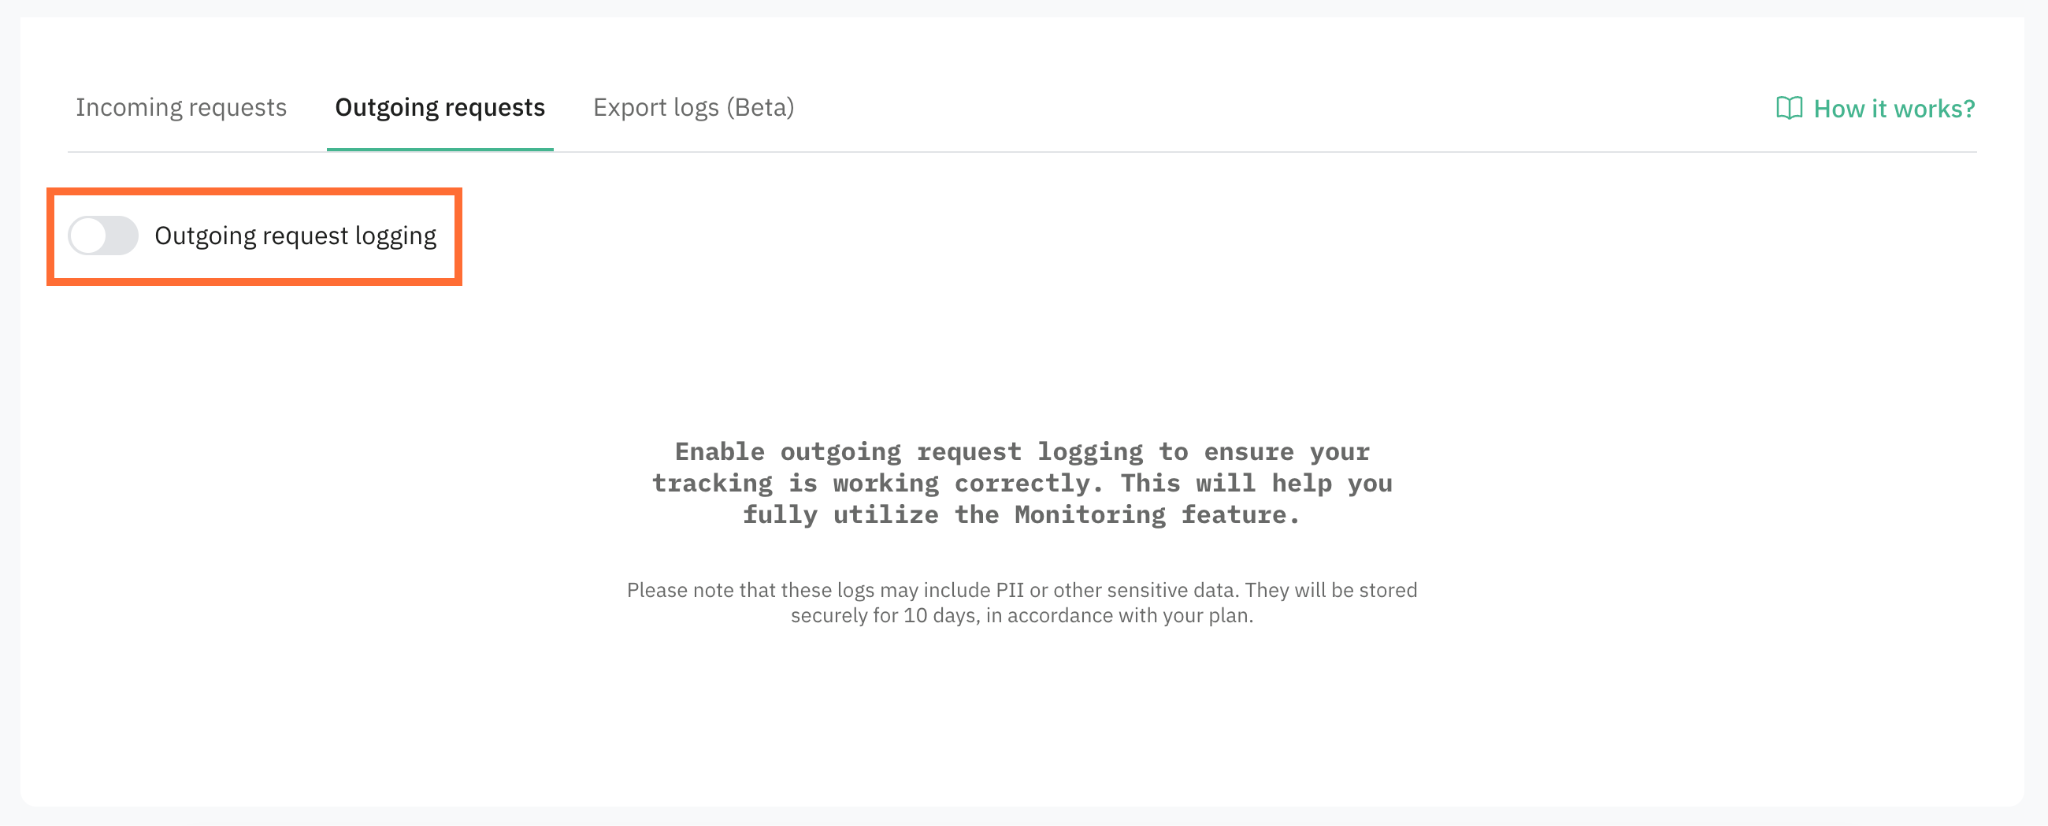
Here you can find requests sent from your sGTM container to third-party platforms (for example, Meta Conversions API or Google Analytics).
Toggle Outgoing request logging to start collecting outgoing logs. By toggling outgoing logs, you’ll enable the Monitoring feature as well.
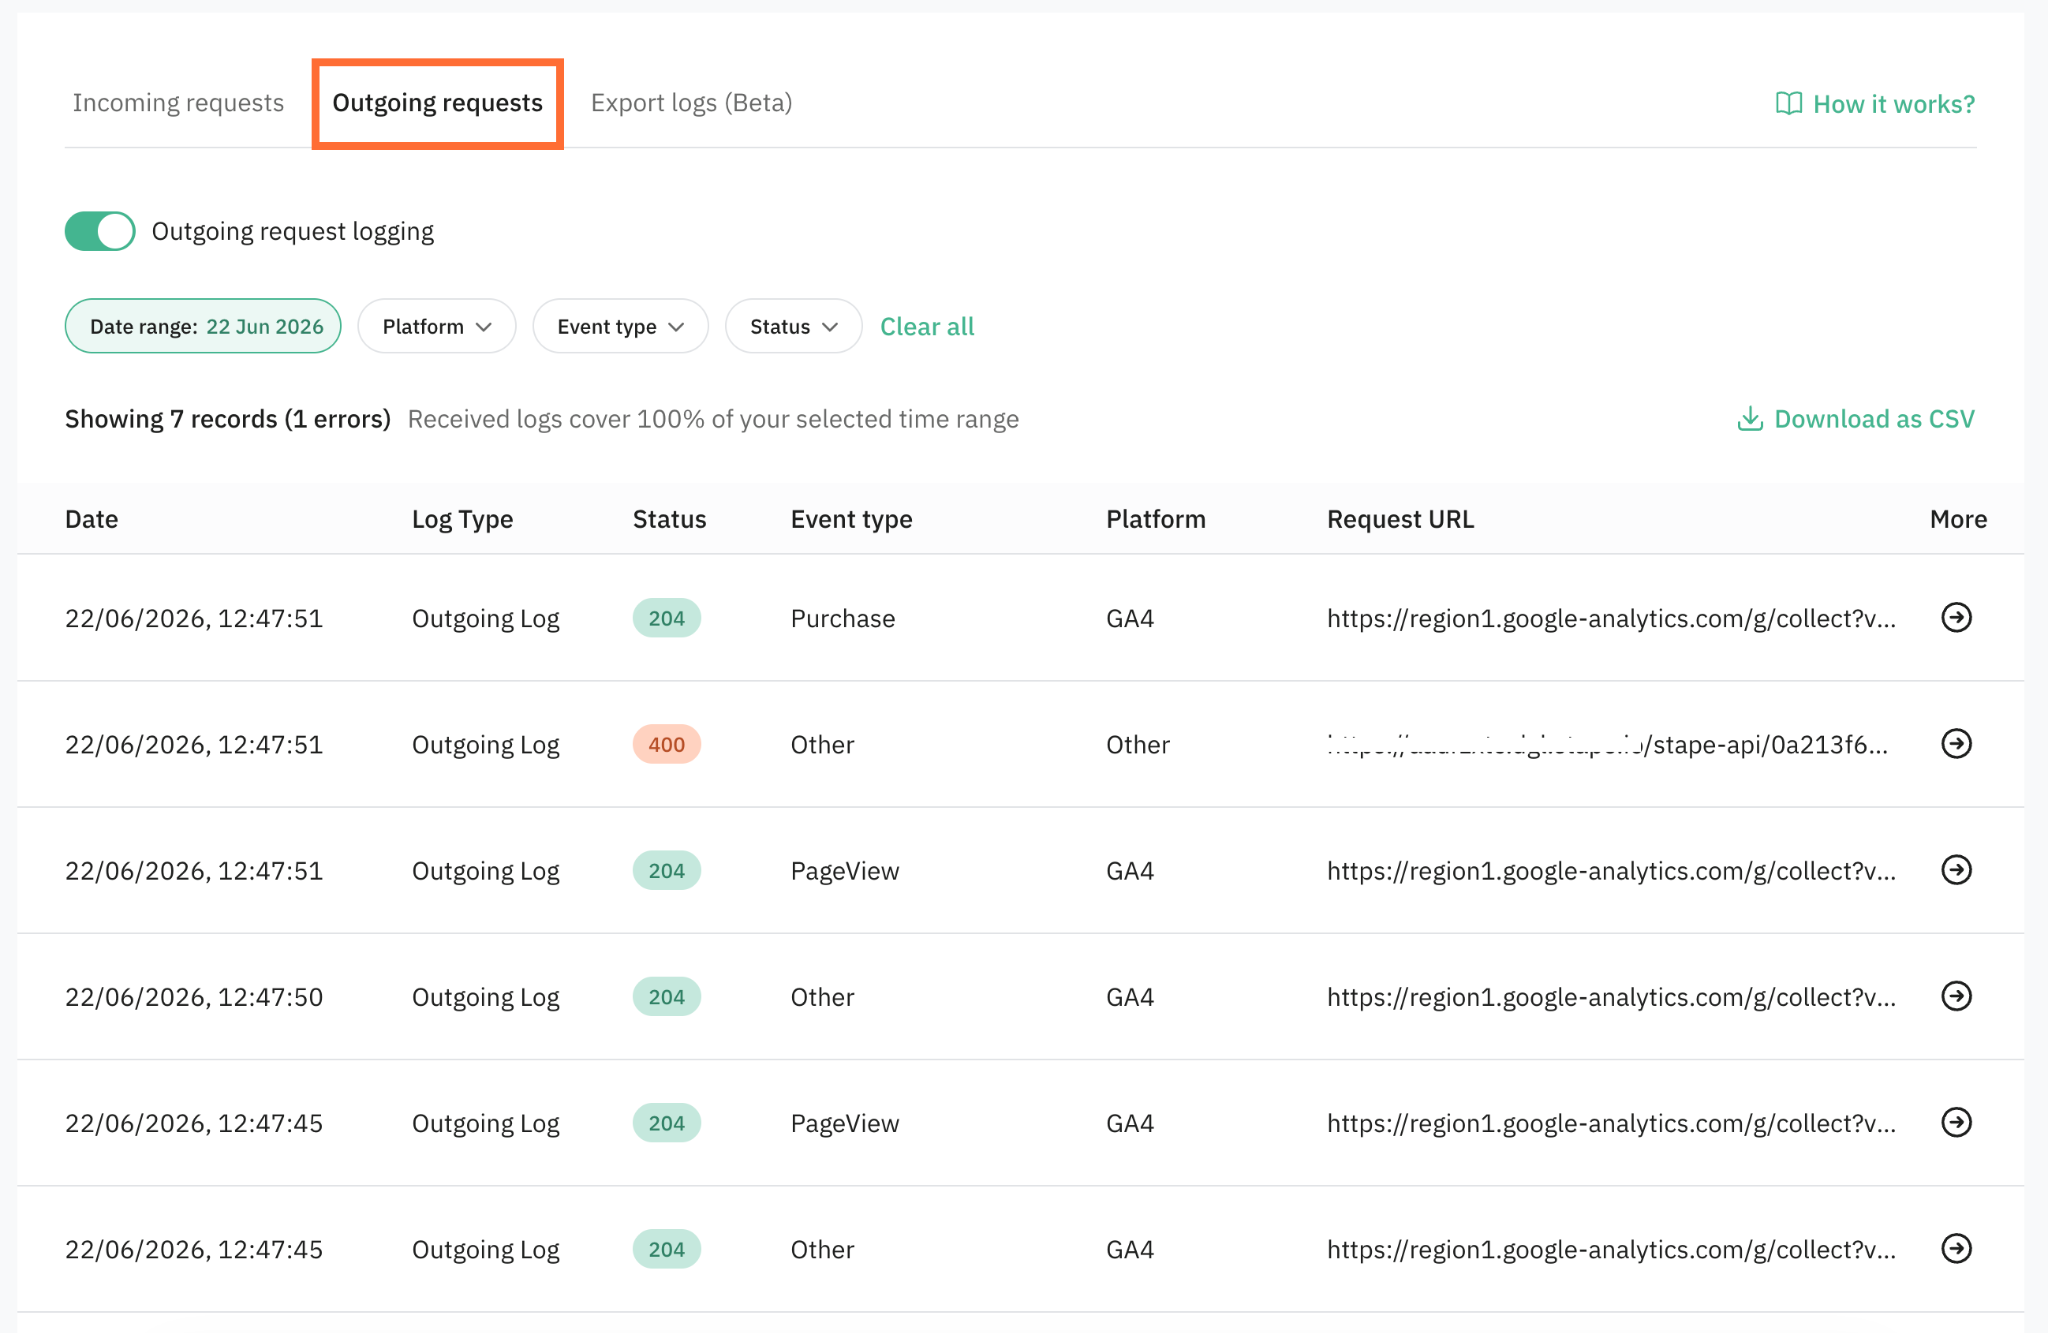
To see the logs, you can apply the following filters:
- Date range – select a specific timeframe to view your logs.
- Platform – the third-party platforms, marketing tools, or services that receive tracking data from your sGTM container.
- Event type – Stape automatically classifies your outgoing sGTM requests into standardized categories. You can read about each specific event in Google documentation.
- Status – the response status code. For the detailed explanation read Logs status codes.
After applying all of the filters, the logs will appear on the dashboard. Click Download as CSV to download the data.
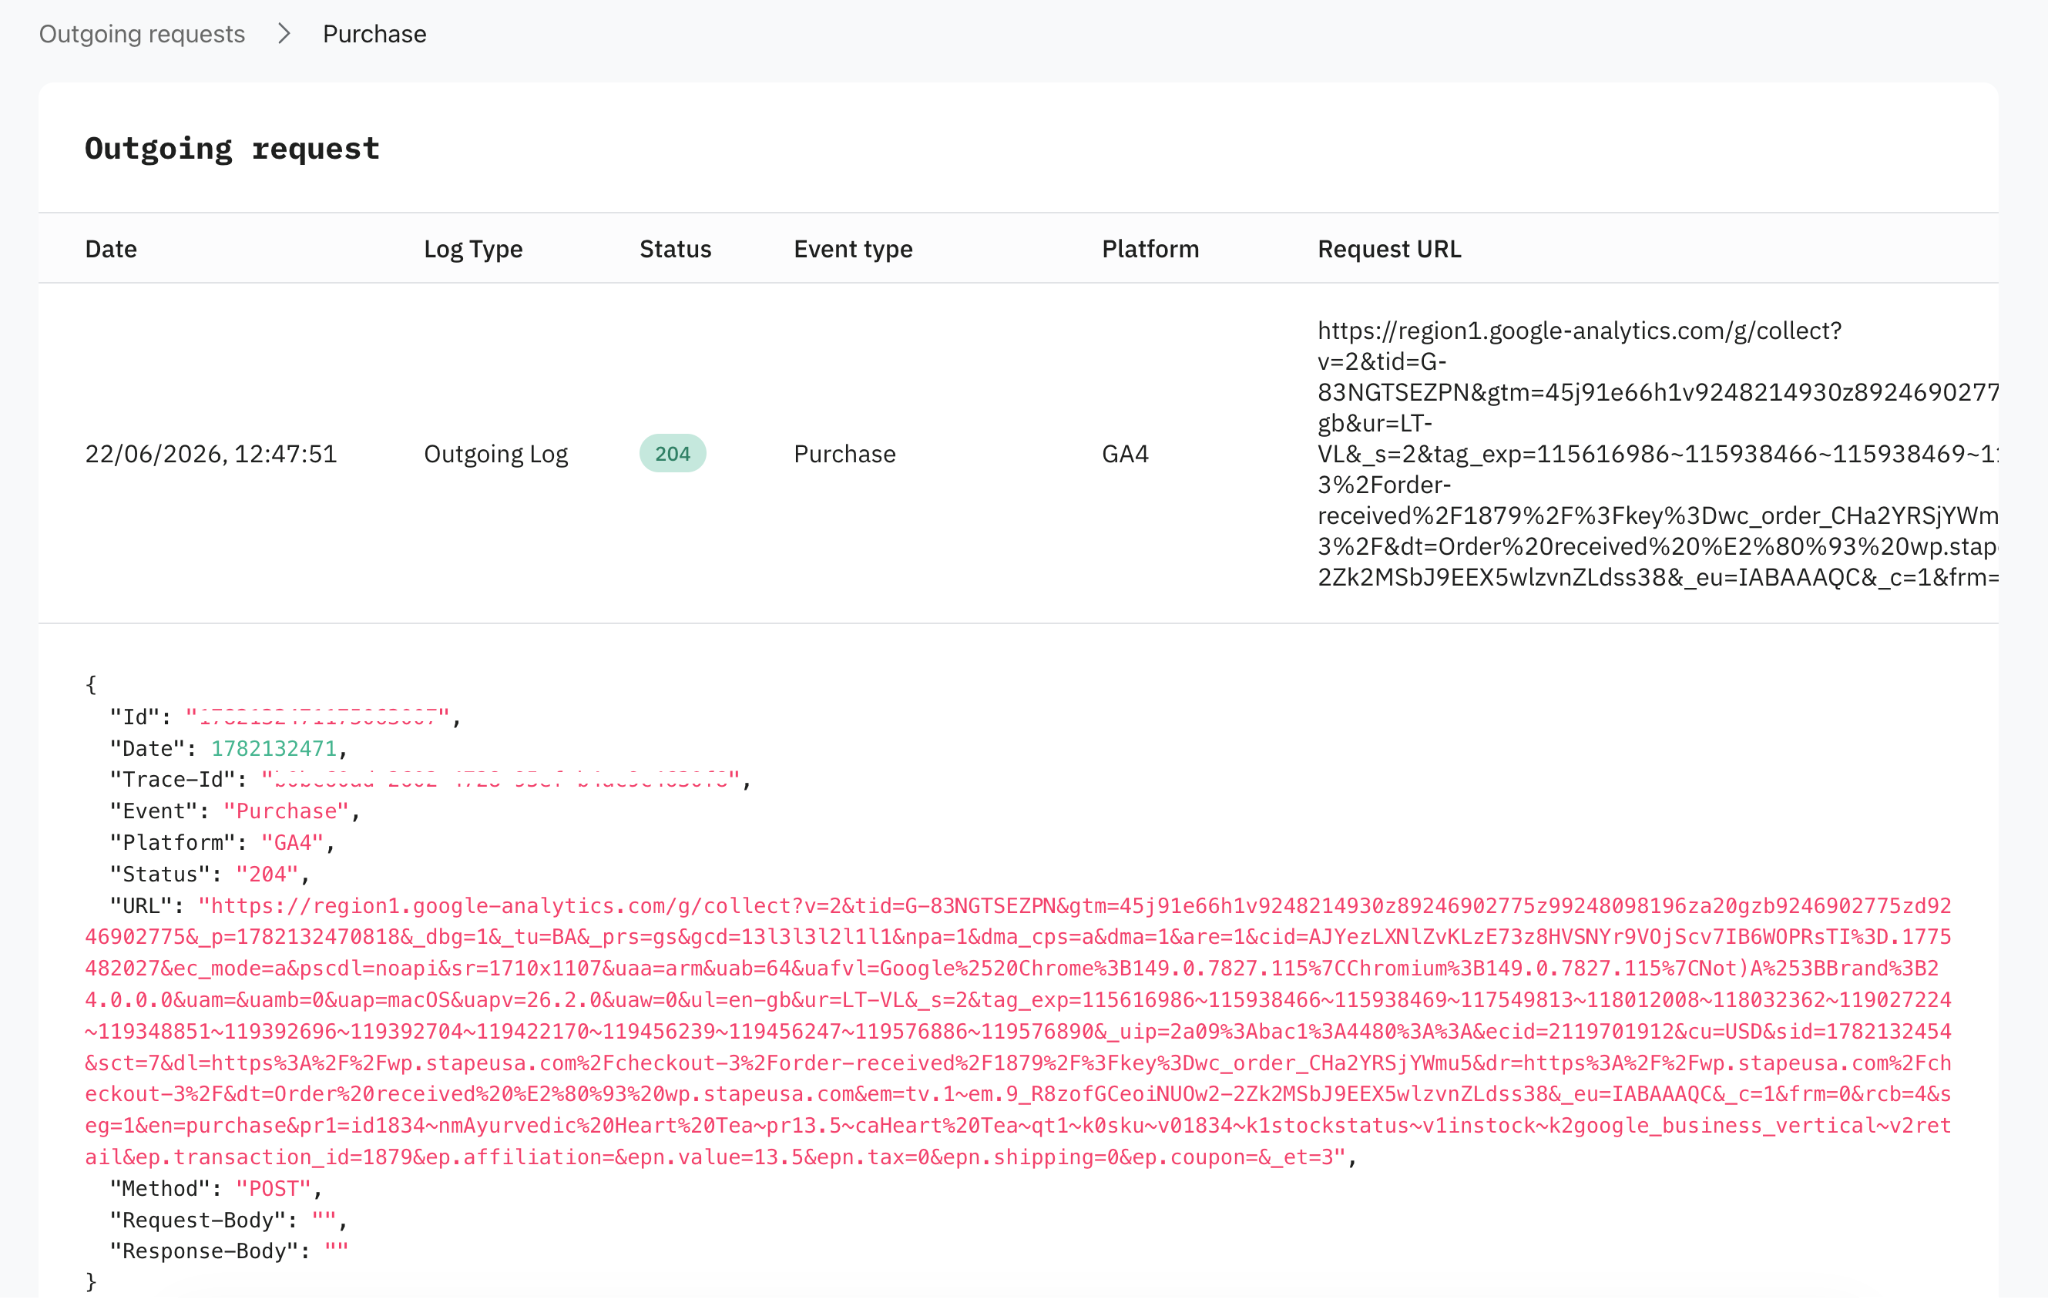
Click the More icon to open the full log details page. This view gives a comprehensive breakdown of the data payload sent to the third-party platform, including its full JSON metadata. You’ll also see related incoming requests within the same flow under Associated logs, allowing you to trace exactly which event triggered the request. This page is a diagnostic tool, giving you visibility into your data transmission.
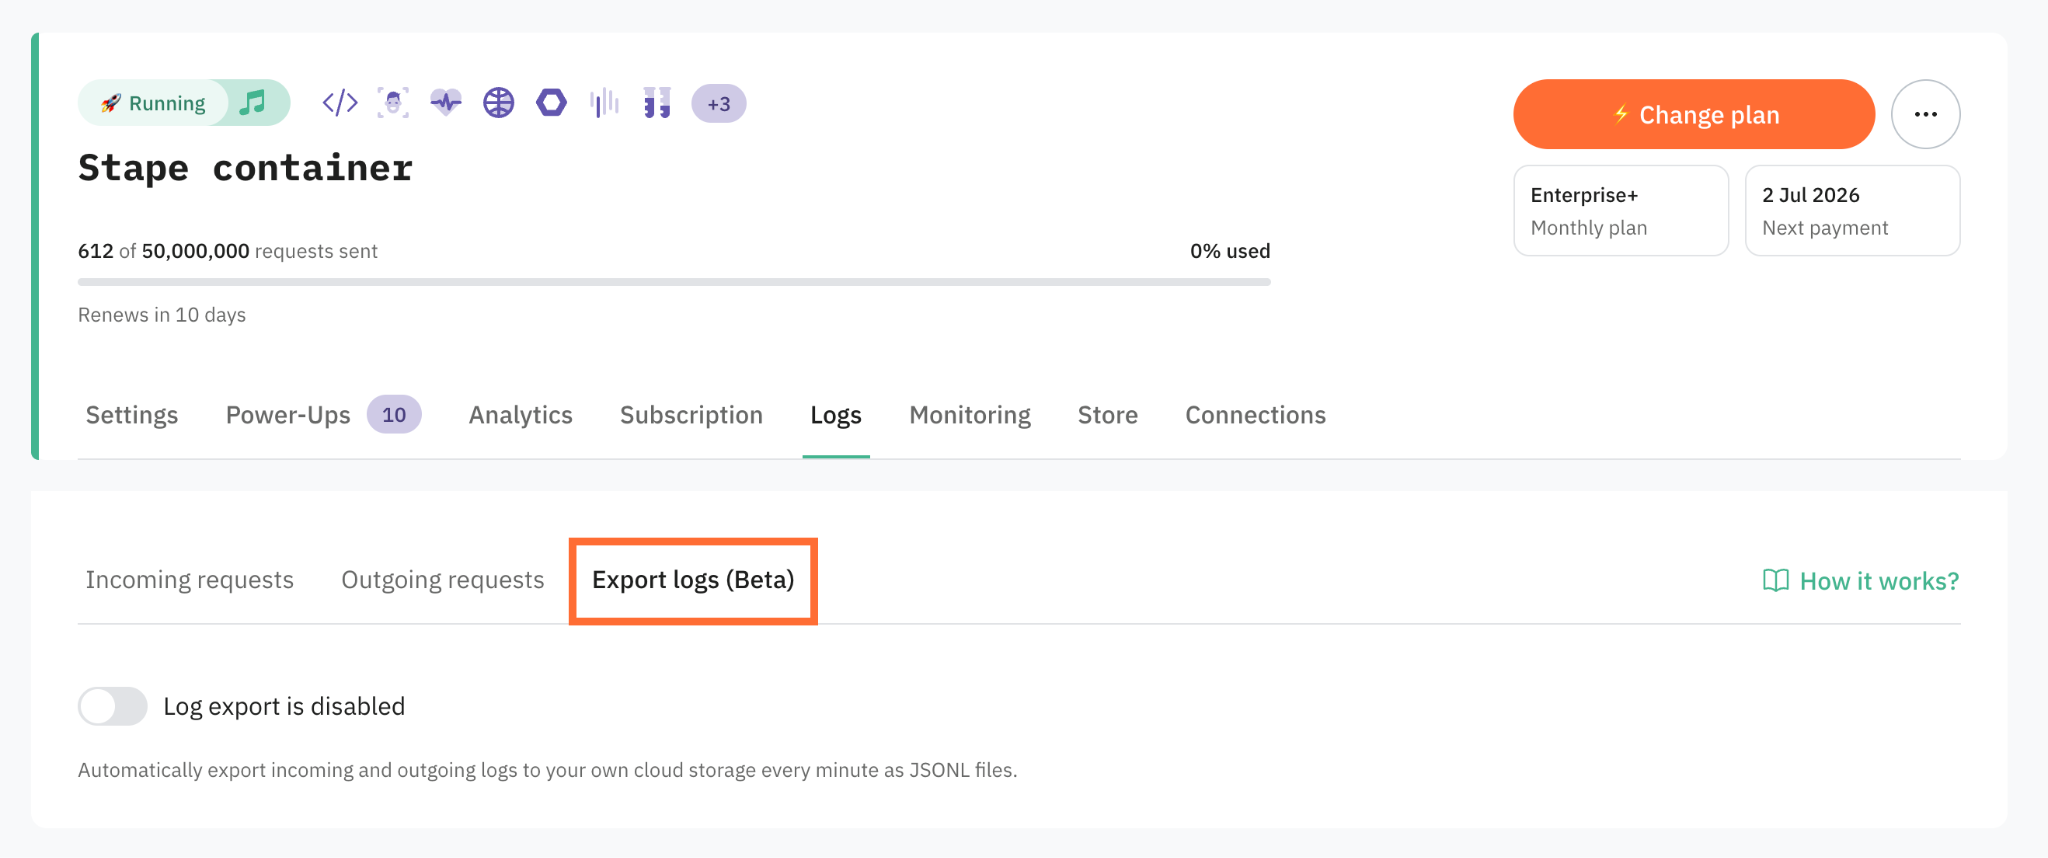
Export logs
Keep your logs indefinitely by setting up automatic, real-time exports to your preferred storage solution. Stape supports direct integration with:
- AWS S3 bucket
- GCP bucket
- Other S3-compatible storage (such as DigitalOcean Spaces, Cloudflare R2, etc.)
This allows you to bypass standard retention limits and feed your data into your own monitoring or analysis tools.
For more information on how to export logs to each bucket read the following articles:
Use cases
Take a look at the following examples of use cases for Logs:
Was this article helpful?
Comments