Requests Analytics overview
Updated Oct 12, 2026
Requests Analytics monitors the effectiveness of your server-side tracking. It identifies events and requests recovered after bypassing ad blockers and browser-based tracking prevention tools (such as Safari's Intelligent Tracking Prevention). Requests Analytics gives you a clear, visual picture of exactly how much data is recovered. This helps you understand how much your data quality has improved.
In Requests Analytics you can find the following metrics:
- Data recovery. You can see the percentage and volume of events that client-side tracking missed but server-side tracking successfully captured.
- Traffic by sGTM client. Incoming requests are grouped by the client that handled them (for example, GA4 or Data Client), so you can see where your traffic comes from.
- Traffic by browser. Metrics are sorted by browser (Safari, Chrome, Firefox, etc.), making it easy to spot where tracking blockers are most active.
- Bot filtering. Bot traffic is identified separately, so you get a cleaner view of real user activity.
For the instructions on how to turn on and manage Requests Analytics, read How to set up Requests Analytics.
Notes:
- For Requests Analytics to work, you will need the Custom Loader power-up. It loads your GTM script through a custom path, helping reduce the impact of ad blockers on data collection.
- You can get some analytics data without enabling Custom Loader, but it’s highly recommended to enable the power-up for the highest performance.
- Requests Analytics is designed to measure data recovery bypassed by the Custom Loader power-up. It doesn’t track offline server-to-server data (such as webhooks from CRMs like HubSpot or Salesforce).
- To view the metric showing how many requests Cookie Keeper power-up has processed, you need to enable the Cookie Keeper power-up.
Dashboard
Analytics
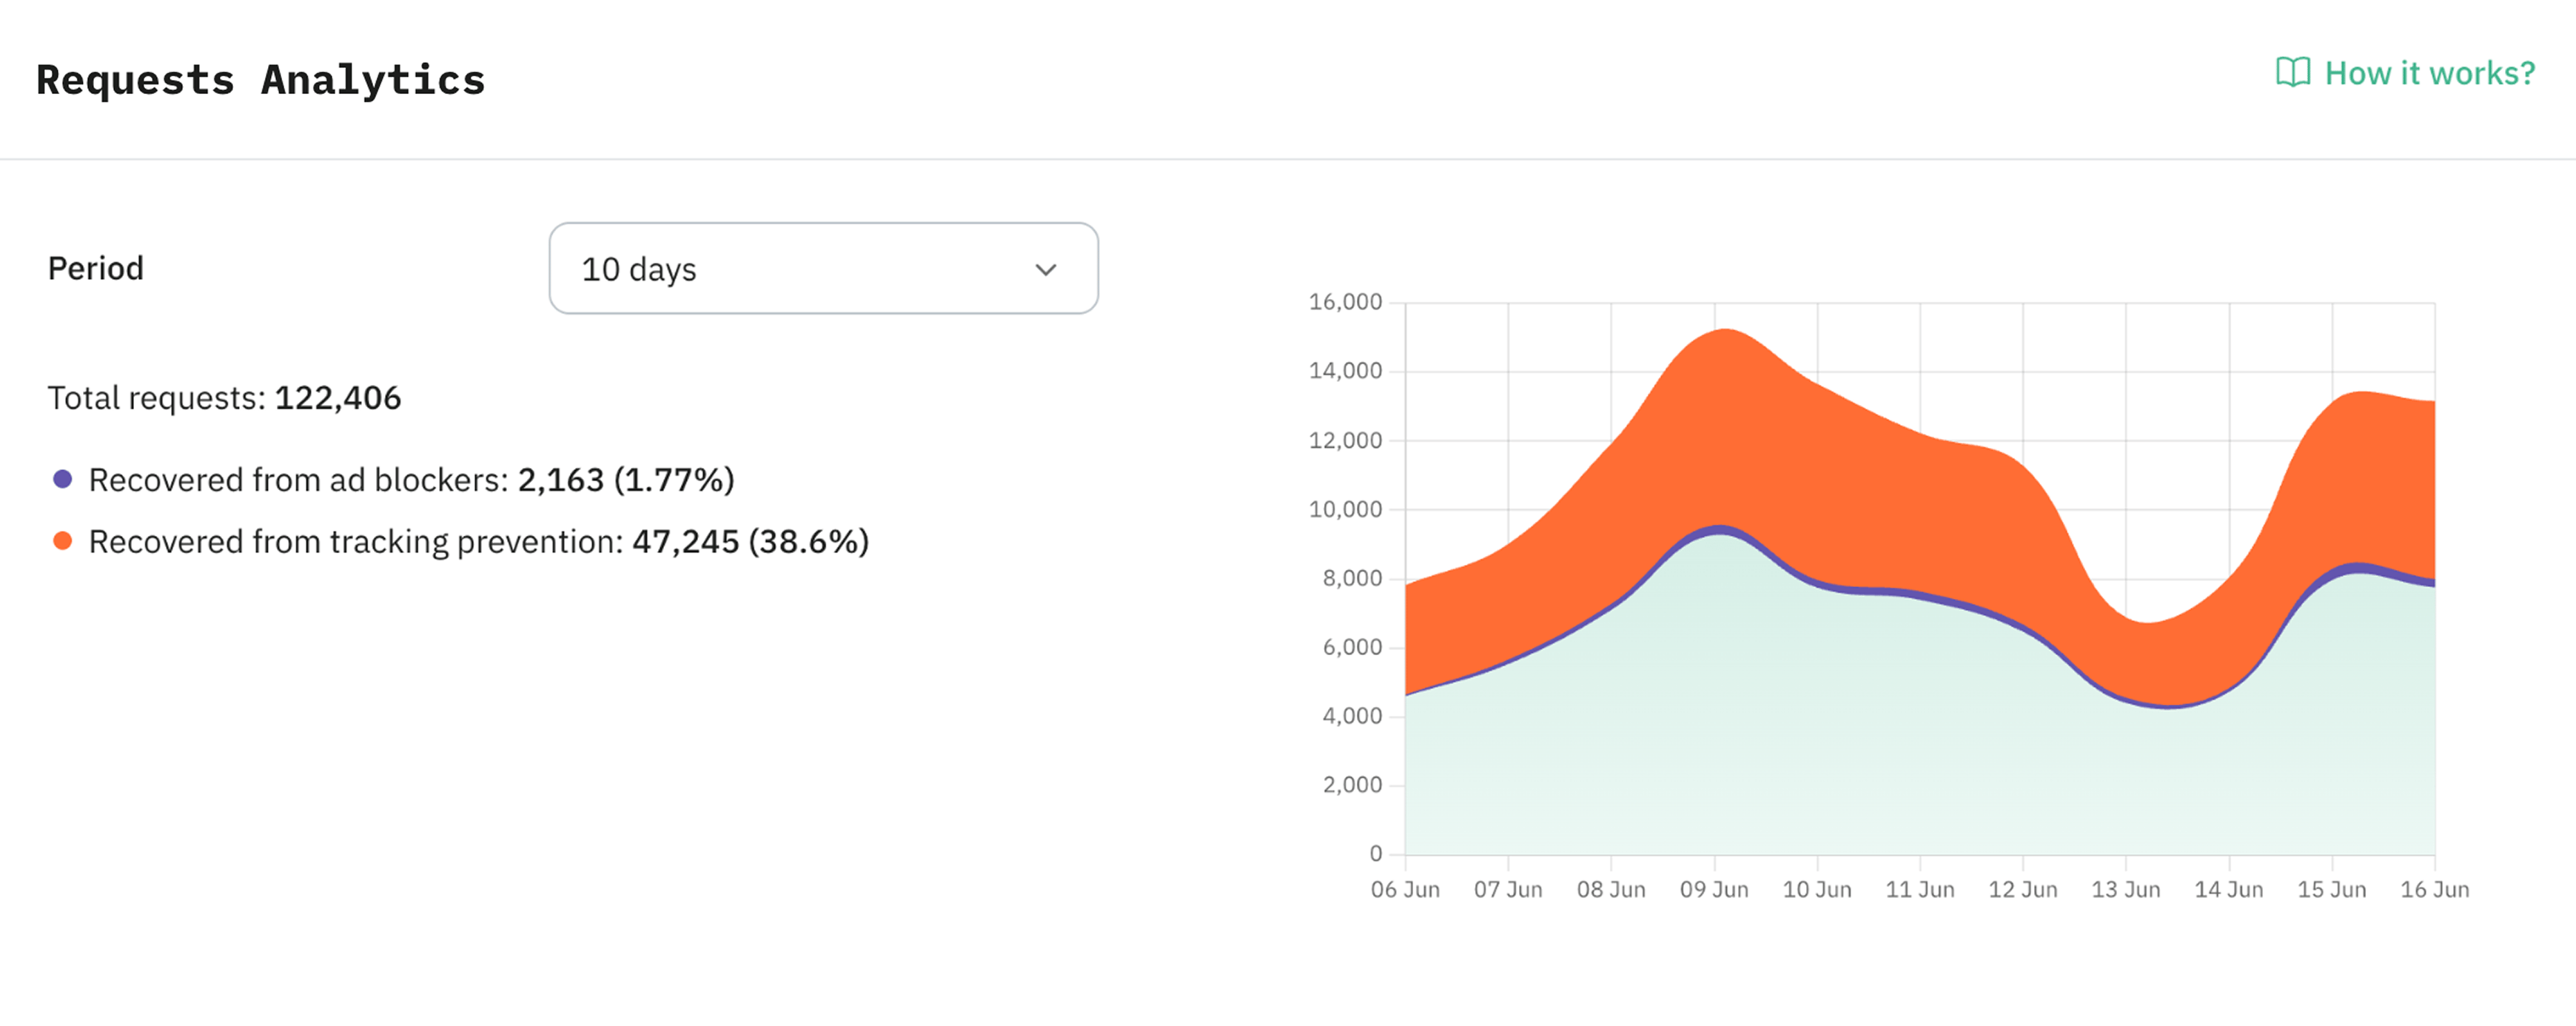
This section displays the volume of requests recovered by bypassing ad blockers and browser-based tracking preventions:
- Recovered from ad blockers – the number and percentage of requests saved by the Custom Loader power-up that would have otherwise been stopped by ad blockers.
- Recovered from tracking prevention – tracks the volume and percentage of requests successfully recovered, even when facing tracking prevention algorithms in browsers like Safari and Firefox.
Requests by client
Here you can get detailed performance insights for every client processing requests within your sGTM container:
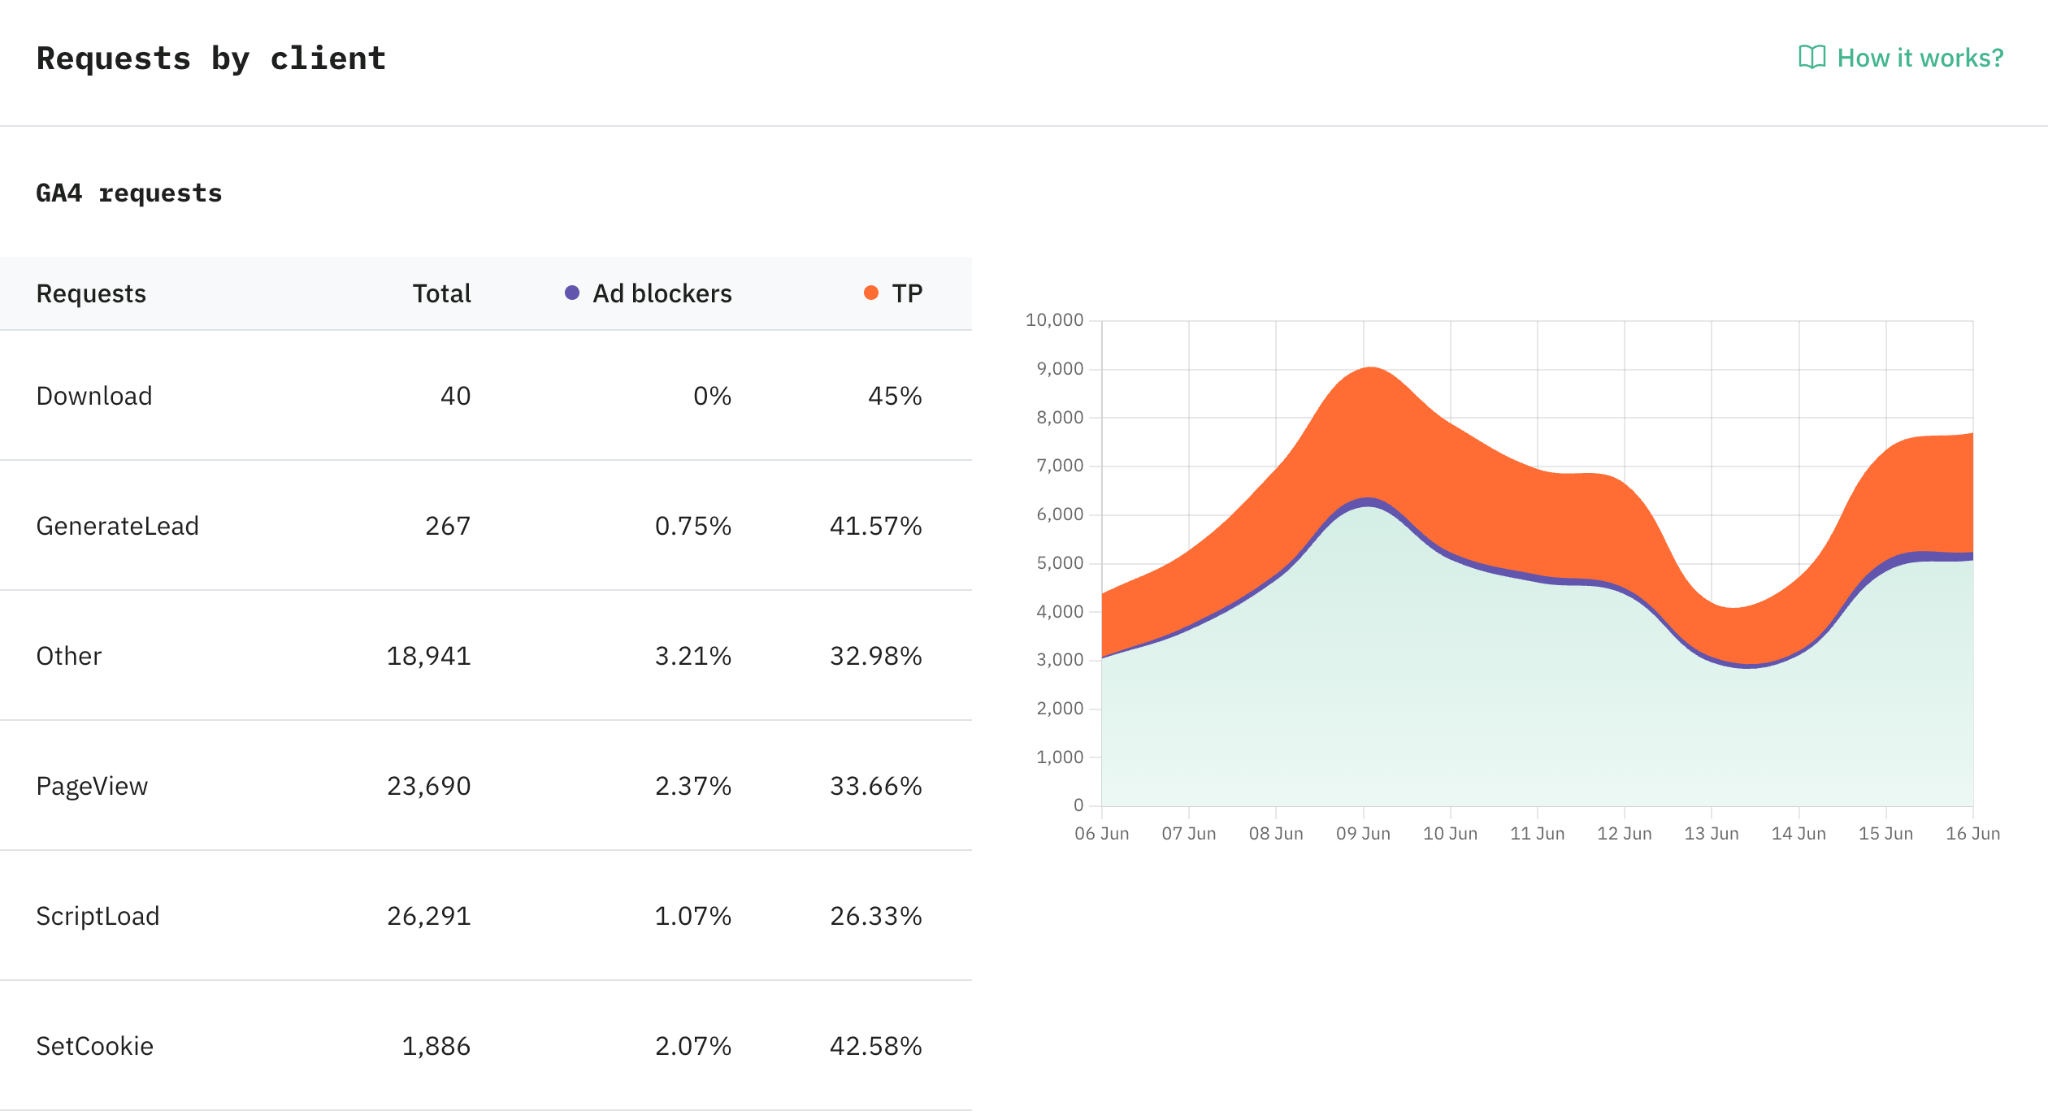
GA4 requests – metrics for requests claimed by the Google Analytics 4 client. The requests are categorized by standard event name, grouping any unidentifiable events as "other." For each event, you can see the total request count alongside the percentage recovered from ad blockers and tracking prevention.
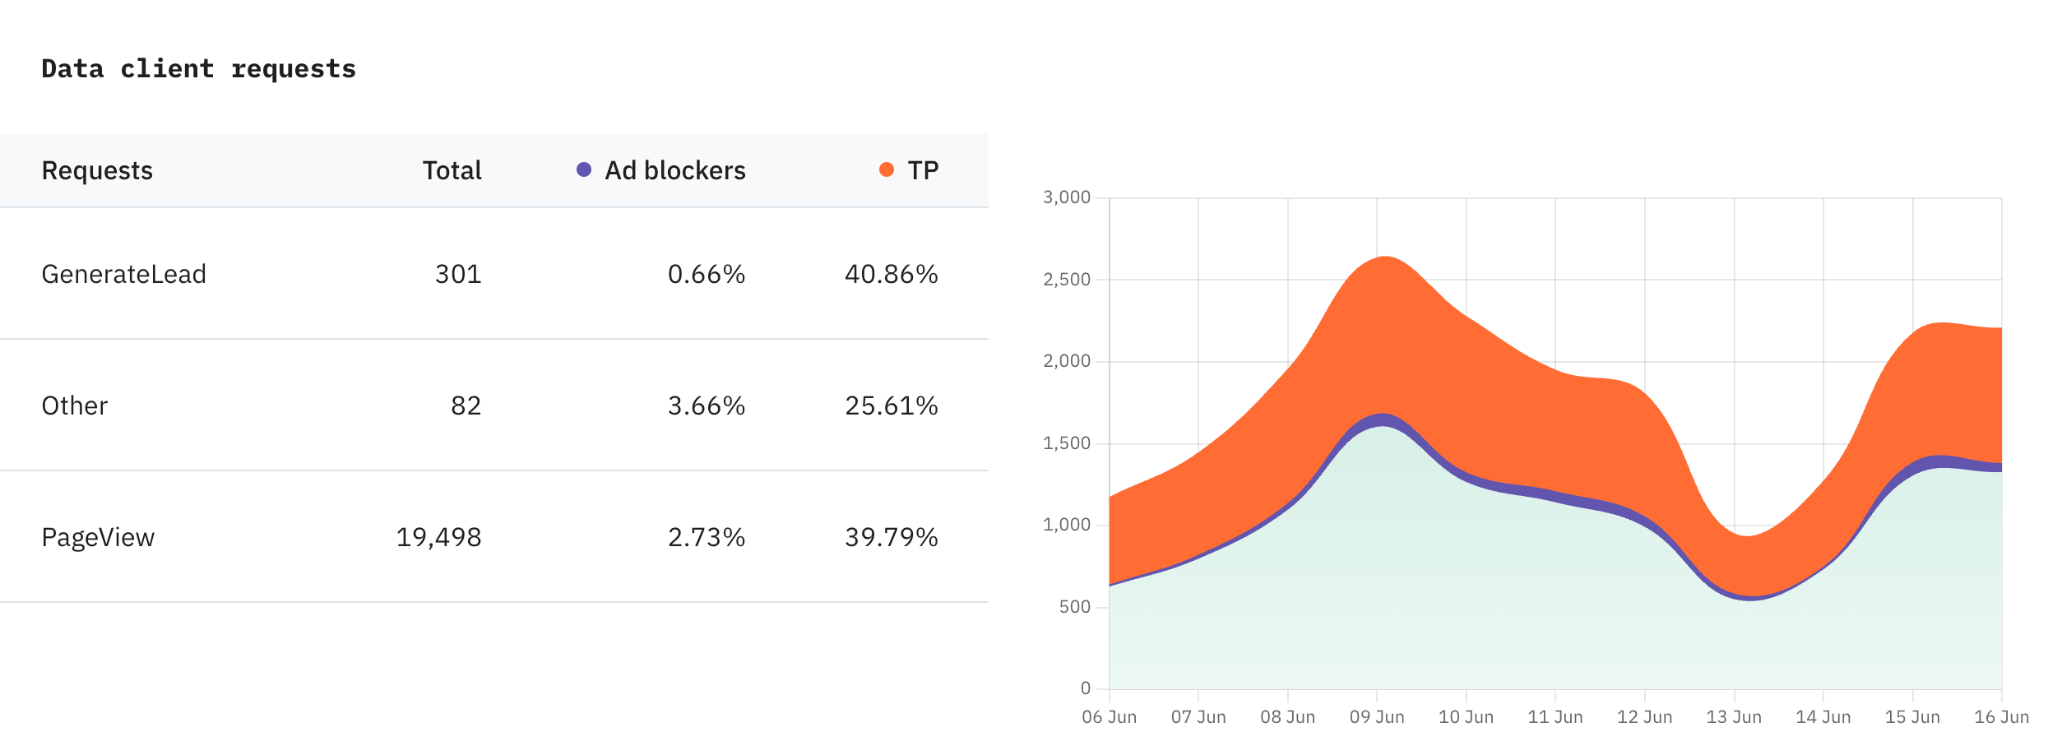
Data Client requests – provides a breakdown of requests claimed by the Data Client, displayed with the same level of detail as GA4.
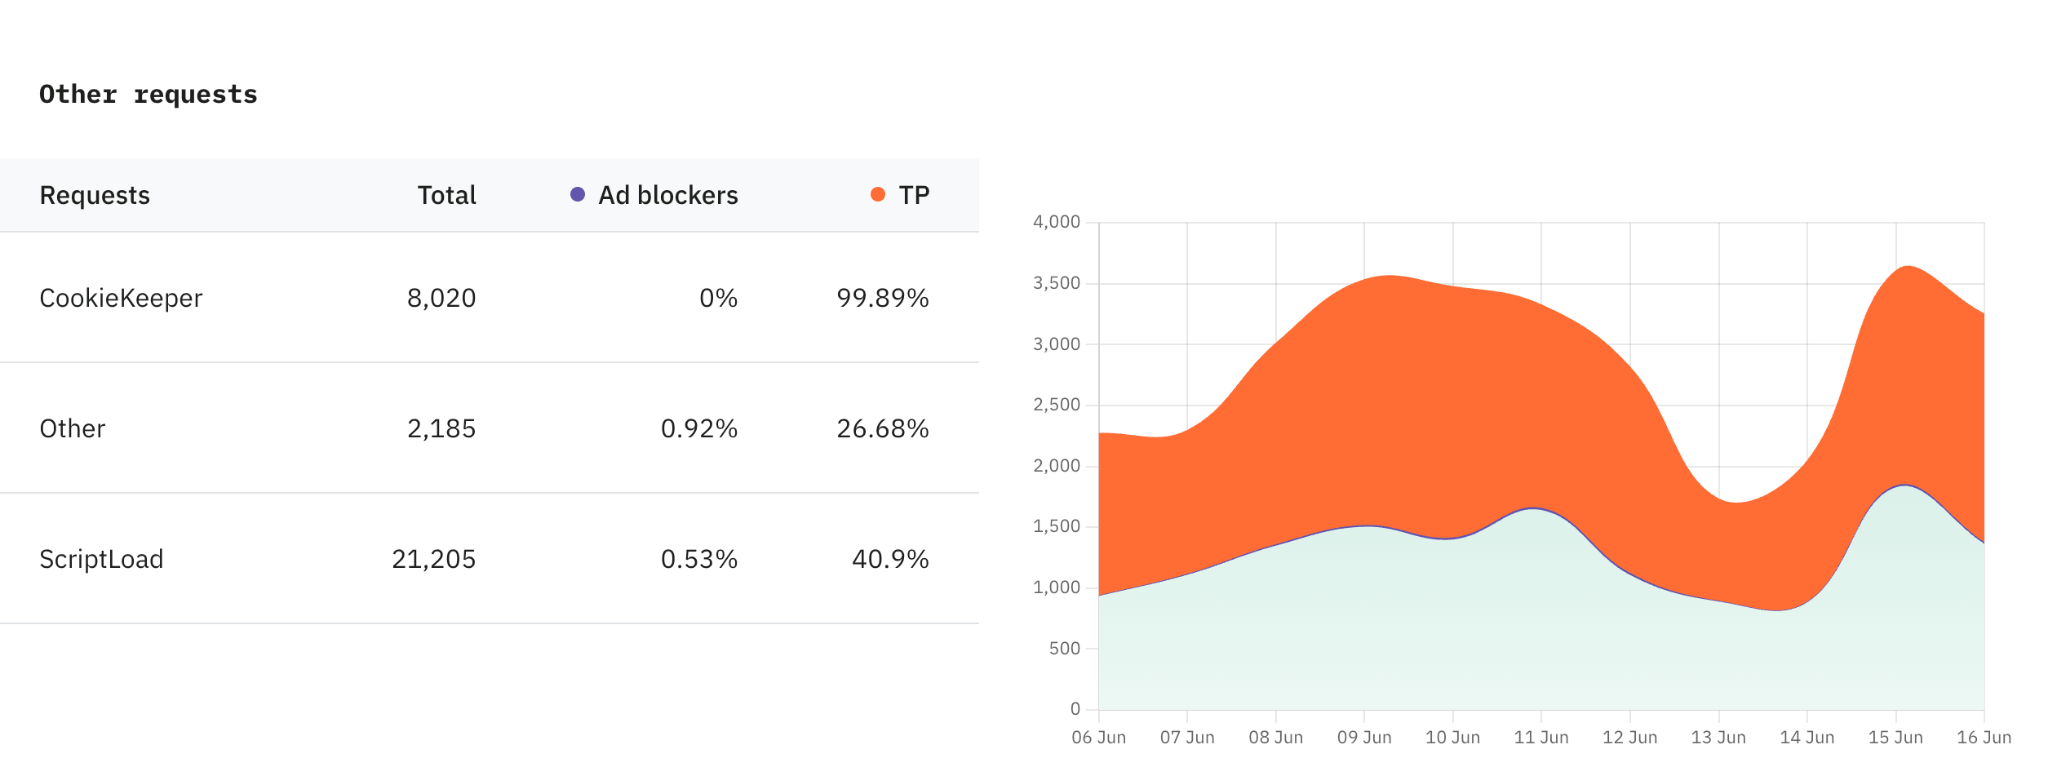
Other requests – all remaining traffic not claimed by GA4 or the Data Client, including GTM loads, Cookie Keeper events, and JavaScript events.
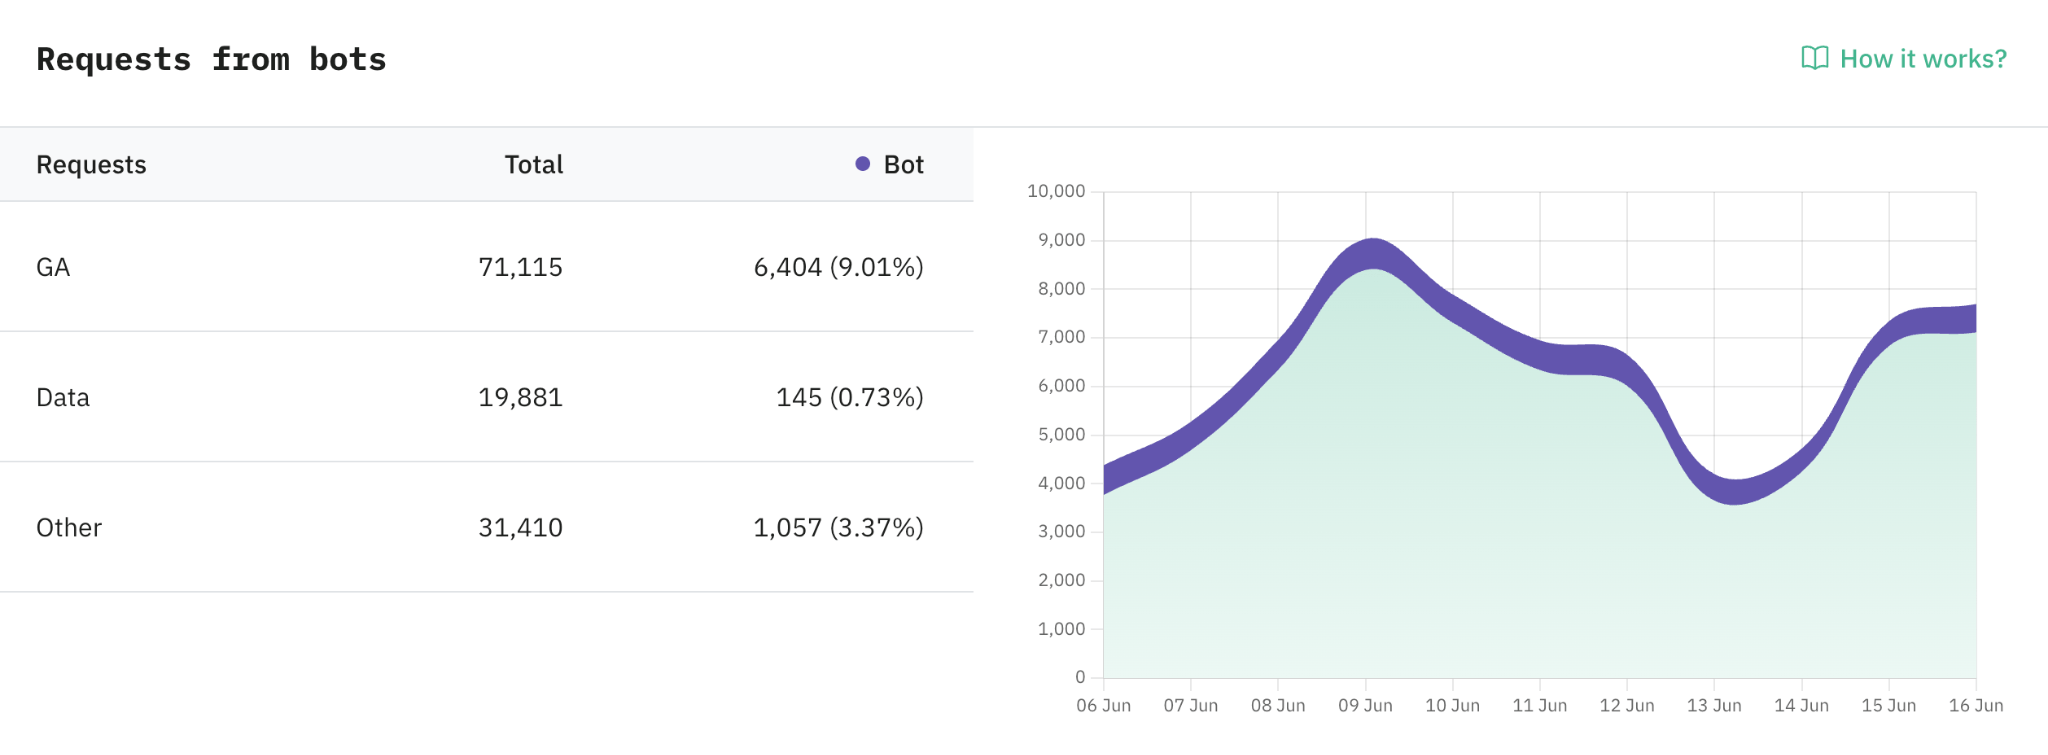
Requests from bots
This section breaks down bot traffic detected across the GA4, Data Client, and Other categories. For each category, you can view the total requests processed, the number of bot requests identified, and what percentage of your total traffic that represents.
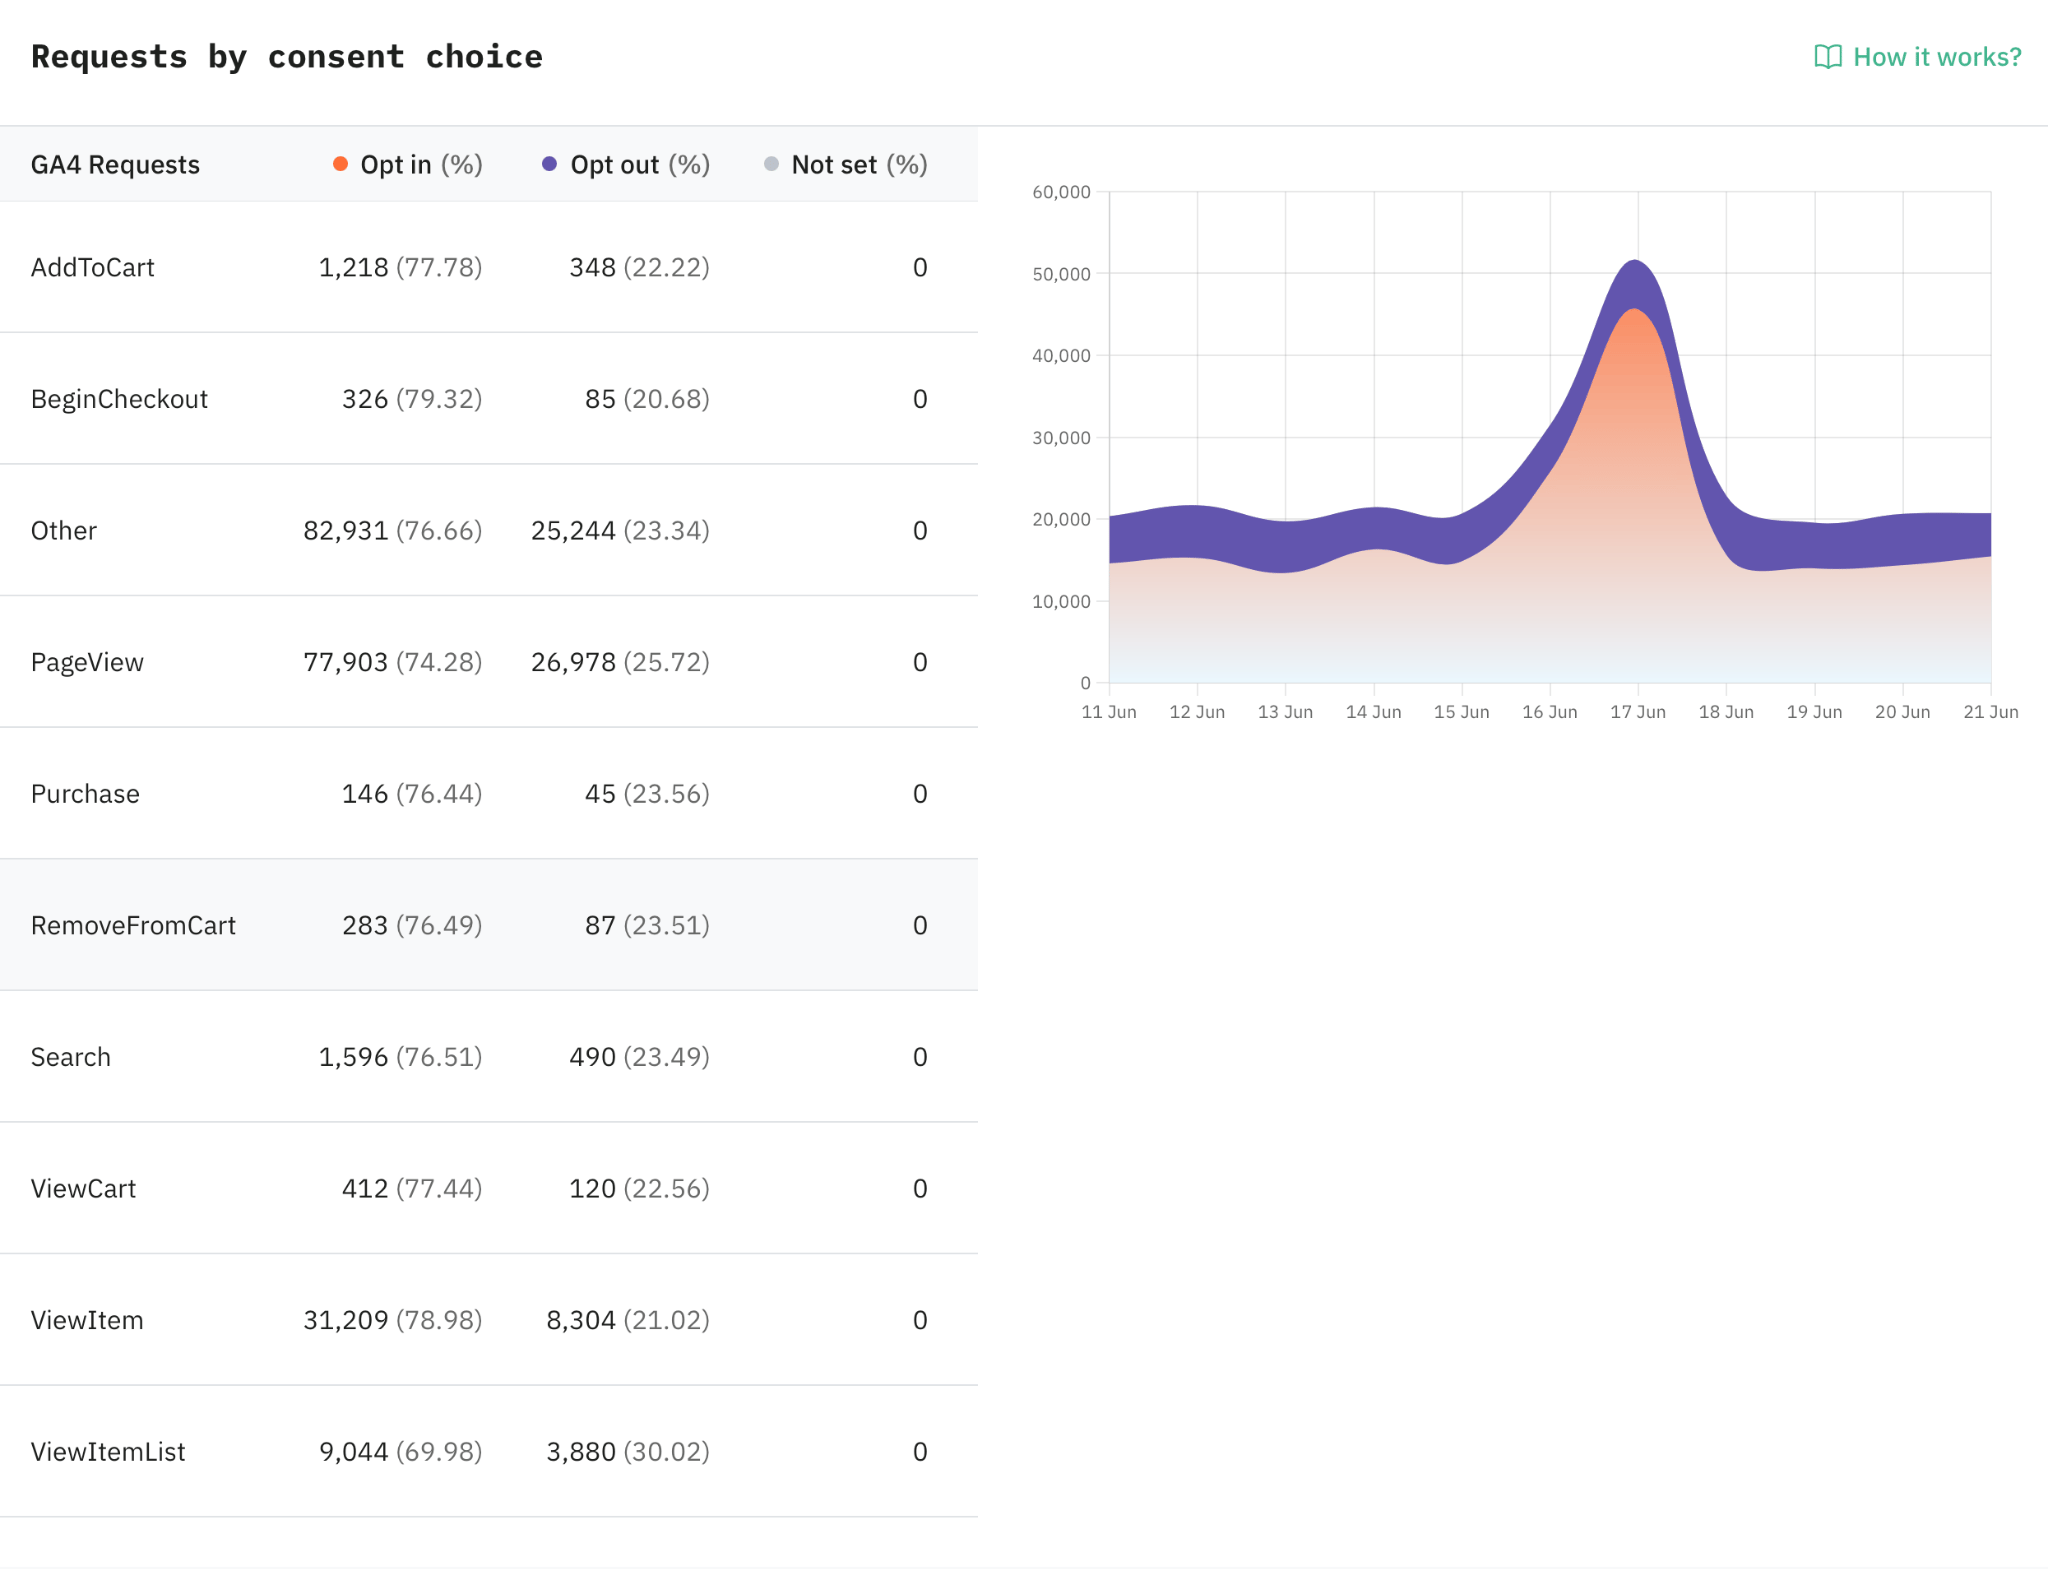
Requests by consent choice
This section organizes requests received by the server according to the user's consent status, determined by the Google Consent Status (gcs) parameter:
- Opt in – users who have fully granted consent for both analytics and advertising storage.
- Opt out – users who have declined consent, though cookieless pings or limited data hits may still be captured (standard behavior with Google Consent Mode).
- Not set – requests where no consent parameter is present. This typically means the consent banner hasn't been implemented, hasn't finished loading, or doesn't support Consent Mode.
Use this dashboard to evaluate your consent banner's effectiveness, track opt-in rates, and ensure your sGTM container accurately reflects user choices. These insights are powered by the gcs and gcd parameters, which are automatically included whenever you use a consent banner compatible with Google Consent Mode.
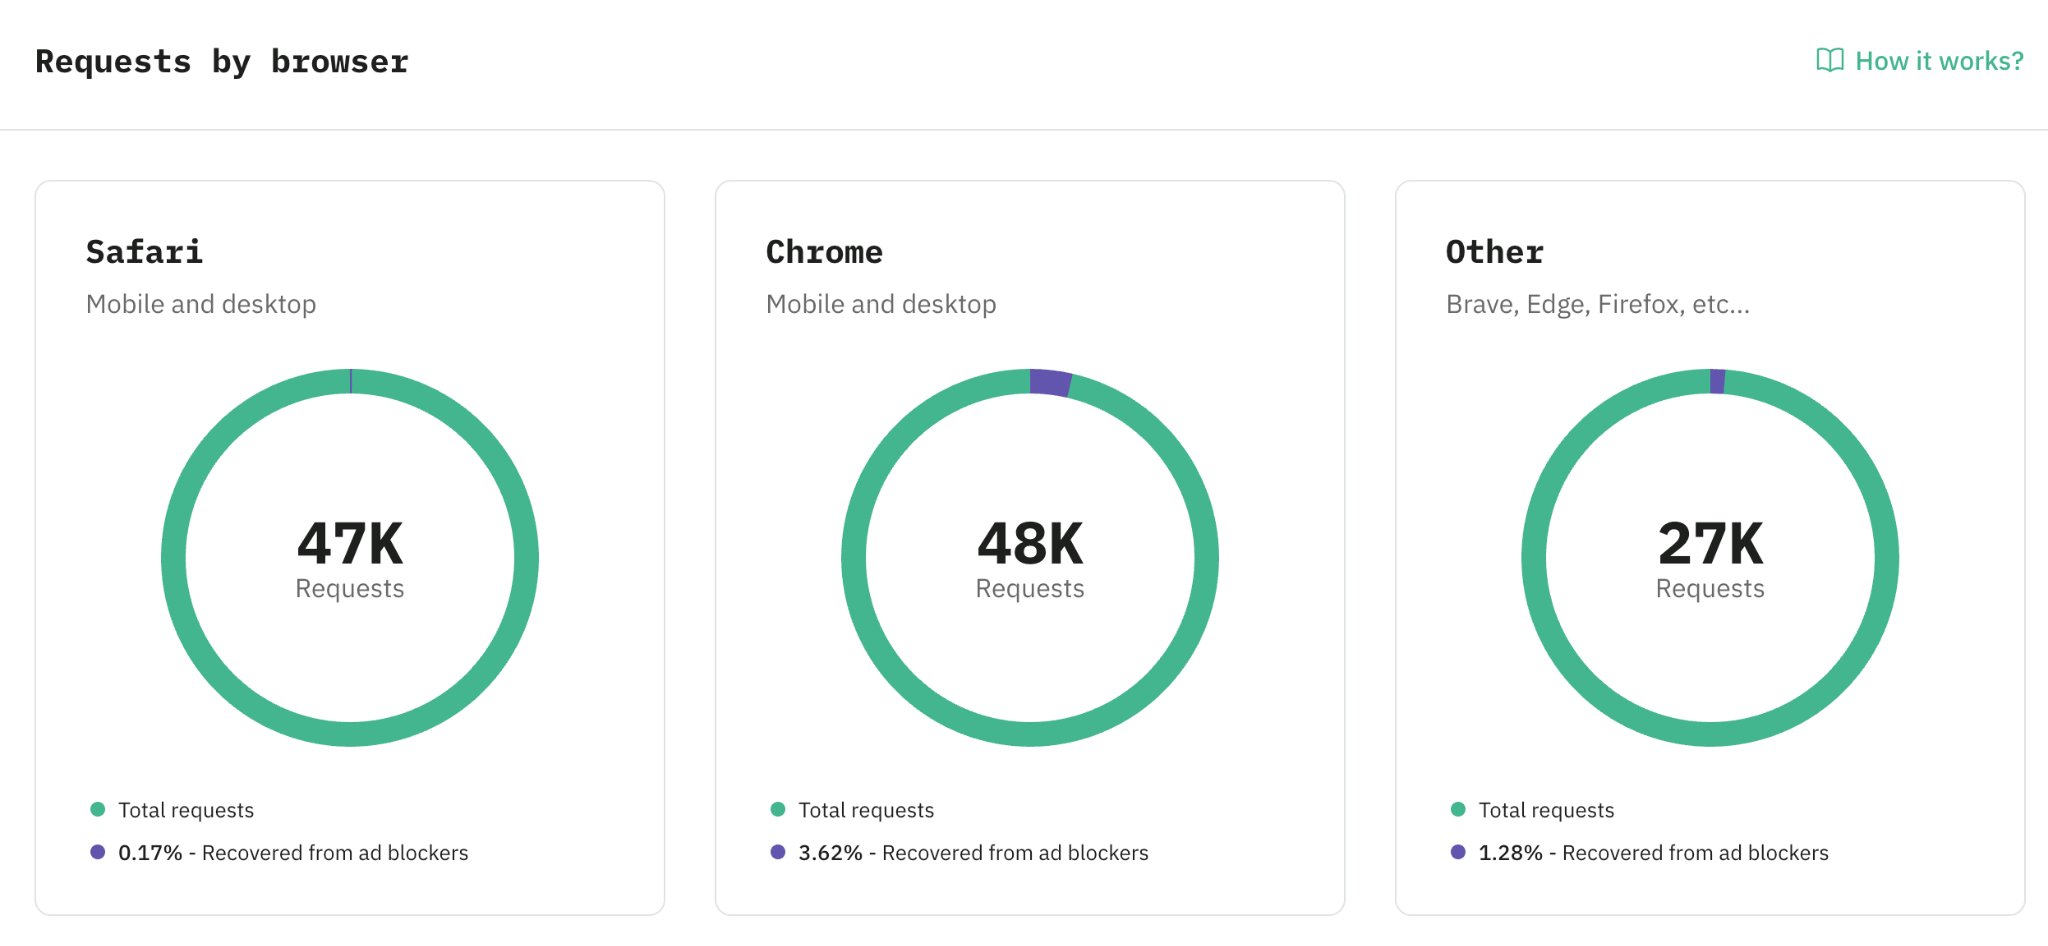
Requests by browser
This section provides a breakdown of your traffic by browser, along with the percentage of requests recovered for each. This helps you quickly identify which browsers are causing the most significant blocking.
Was this article helpful?
🍽 Table of content:
Comments