How to sync Requests Analytics to Google Sheets & Looker Studio
Written by
Alif Mahmud
If you're running server-side tracking through Stape, the Analytics tab already knows something most clients never see: exactly how much traffic your setup is recovering from ad blockers and browser tracking prevention – Safari's Intelligent Tracking Prevention (ITP), Firefox's Enhanced Tracking Protection (ETP), all of it.
That number is usually the best proof you have that server-side tracking is working. And right now, it's stuck behind a login.
If you'd like to present these results to a client, you can either take screenshots or share your screen, as automatic export isn't available at the moment.
This post covers a small Google Apps Script that solves that by pulling the data out through Stape's Analytics API and organizing it into Google Sheets, ready to plug straight into Looker Studio. No manual exports, no shared logins, no screenshots.
What is Requests Analytics?
Requests Analytics is a built-in dashboard inside your Stape container that shows how your server-side setup is performing, separate from Google Analytics 4 (GA4) and any ad platform. It's not tracking conversions or revenue. It's tracking something narrower and more useful for proving your setup is worth what a client is paying for: how many requests would have been lost without server-side tracking, and how many your setup pulled back.
Here's how it looks in practice. Say you open the dashboard for a given week and see:
- Total requests: 962,413
- Adblock recovered: 6,053 (0.65%)
- Tracking prevention (TP) recovered: 140,587 (14.58%)
- Total recovered: 15.23%
That last number means roughly 1 in every 7 requests that week would have been silently dropped on the client side, and server-side tracking caught it instead. On a site doing meaningful ad spend, that's the difference between a campaign that looks like it's underperforming and one that's actually working but under-reporting.
The dashboard also splits this by browser (Safari and Firefox usually show the highest recovery, since that's where ITP and ETP do the most blocking) and by client, so you can see whether the recovery is mostly benefiting GA4, Meta Conversions API, Google Ads, or something else in your container.
None of this is visible anywhere outside the Stape dashboard. There's no export button, and no built-in connector pulls it into a report automatically. If you want to show a client this number today, your only options are opening the dashboard live on a call or taking a screenshot that's outdated within a day.
That gap is what this setup fixes.
How Requests Analytics helps you prove tracking value
If you're running a marketing agency or doing analytics/tracking work for clients, this data solves a handful of recurring problems.
It gives you proof, not a promise. When you pitch server-side tracking, the sell is usually "this will recover data that ad blockers and browser restrictions are hiding from you." That's a believable claim on day one and a hard one to keep proving on day ninety. A live recovery percentage – 15%, 20%, whatever it lands on for that client – turns it from something you said into something they can watch trend upward on a dashboard.
It explains reporting gaps before the client notices them. Anyone doing paid media knows the conversation: "Why did conversions drop last week even though spend didn't change?" Half the time the honest answer is browser-side blocking, not a campaign problem. Having the recovery numbers on hand means you can point to the exact percentage of requests that were affected, instead of guessing out loud on a call.
It's evidence for scope, not just performance. If you're billing for ongoing tracking maintenance, "here's what your server-side setup is actively recovering, every day" is a much easier line item to justify than a static setup fee from six months ago. It's also useful internally – if a client's recovery rate suddenly drops, that's usually a signal something broke in the container before anyone else notices it.
It removes a task you were doing manually anyway. If you're already the person exporting numbers into a slide or a report before a client call, this replaces that with something that updates itself. Ten minutes of setup against however many hours a year you'd otherwise spend copying numbers out of a dashboard.
None of this requires touching GTM, the client's site, or anything beyond a Stape account and a Google Sheet. It's reporting infrastructure, not tracking infrastructure – which is exactly why it's worth having separate from whatever else you've already built.
How this setup works
- 1.It pulls data from four of Stape's own analytics endpoints:
analytics/browsers,analytics/clients,statistics, andanalytics/info; - 2.Writes it into five separate Google Sheets tabs – daily summary, per-browser, per-client/event, billing periods, and a lifetime snapshot;
- 3.Every write deletes existing rows for that date range first, so running it twice never creates duplicates;
- 4.Lets you pull yesterday's data, the last 7 days, or run a full 30-day backfill from a menu inside the sheet;
- 5.Connects directly to Looker Studio, so the dashboard updates on its own – no manual exports before a client call.
Please note
This setup uses analytics endpoints that aren't currently included in Stape's public API documentation. Since these endpoints support the Requests Analytics dashboard, their behavior may change as the product is updated.
Step 1. Get your container credentials
You'll need two things, from two different places.
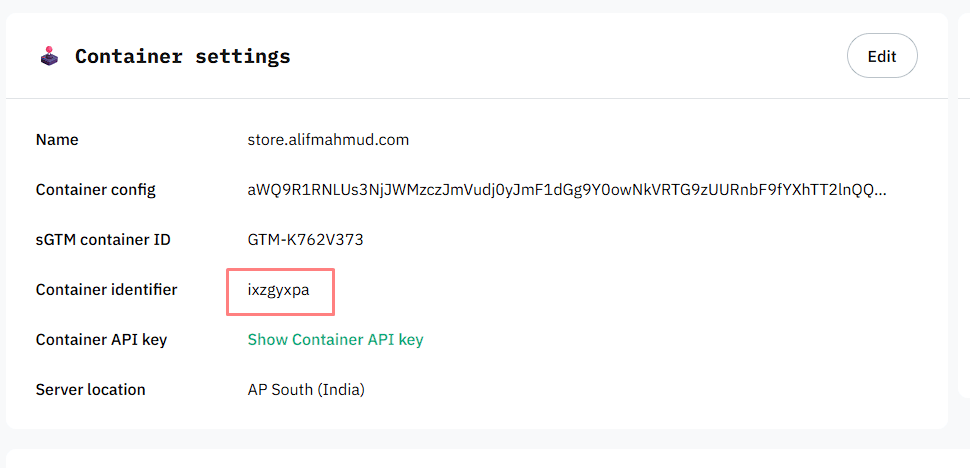
- Container identifier: go to the Stape dashboard → your container → Settings tab. It's labeled there as "Container identifier."
- API token: don't use the "Container API key" shown on that same settings page – that's a different, container-scoped key. What you need is an account-level token: profile icon (top right) → Account settings → API keys → Create API key.
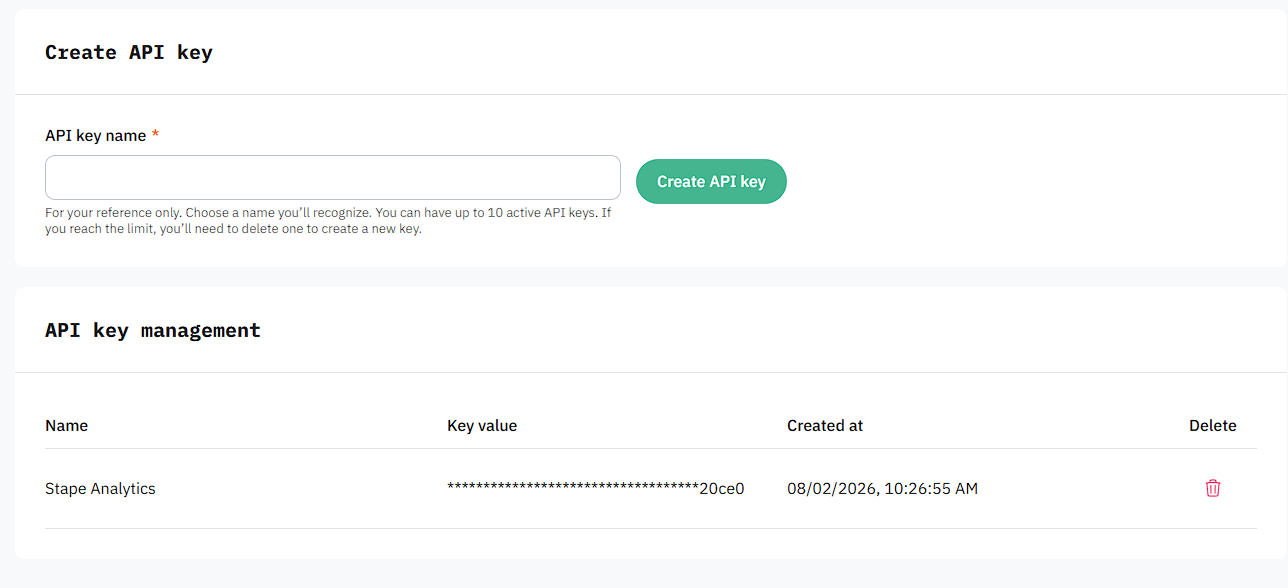
Keep that token private. Don't commit it to a public repo or leave it in a shared doc.
Step 2. Get the script from GitHub
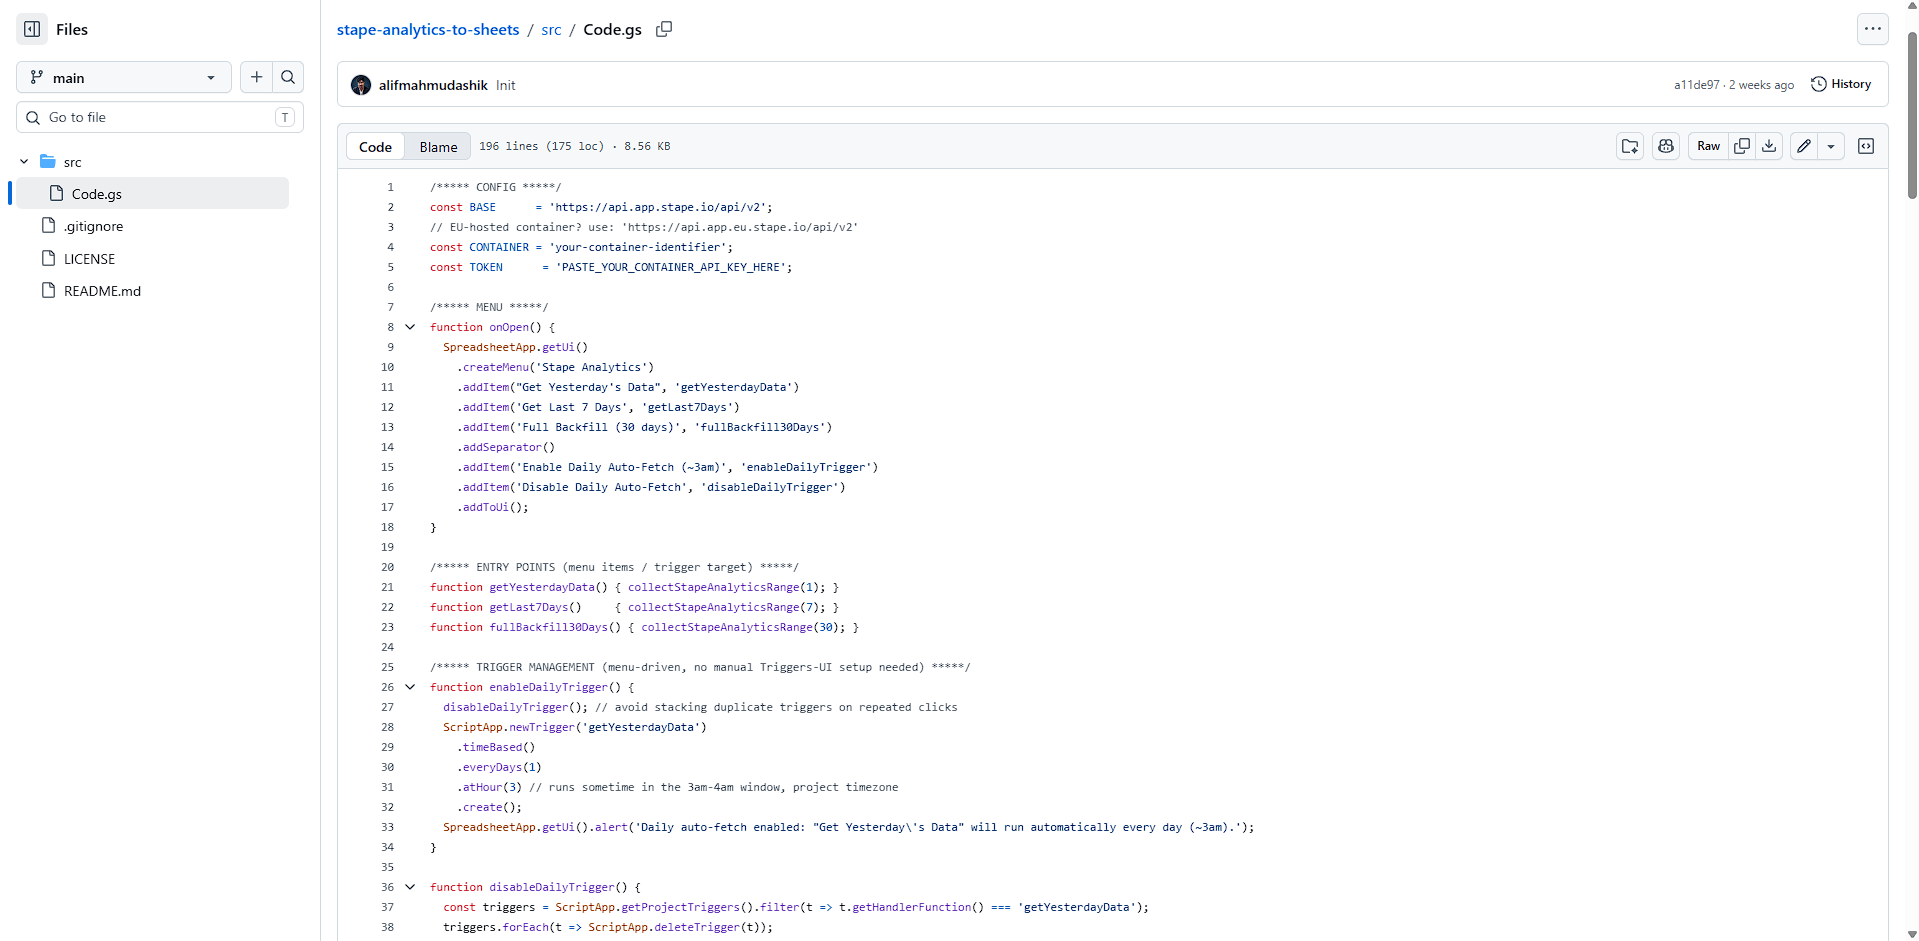
The full script is open source and available on GitHub.
1. Open the repo and go into the src folder.
2. Open Code.gs and copy its contents.
3. Create a new Google Sheet – a blank one is fine; the script builds all the tabs the first time it runs.
4. In that sheet, go to Extensions → Apps Script.
5. Delete the default contents of Code.gs and paste in what you copied from GitHub.
Step 3. Add your credentials
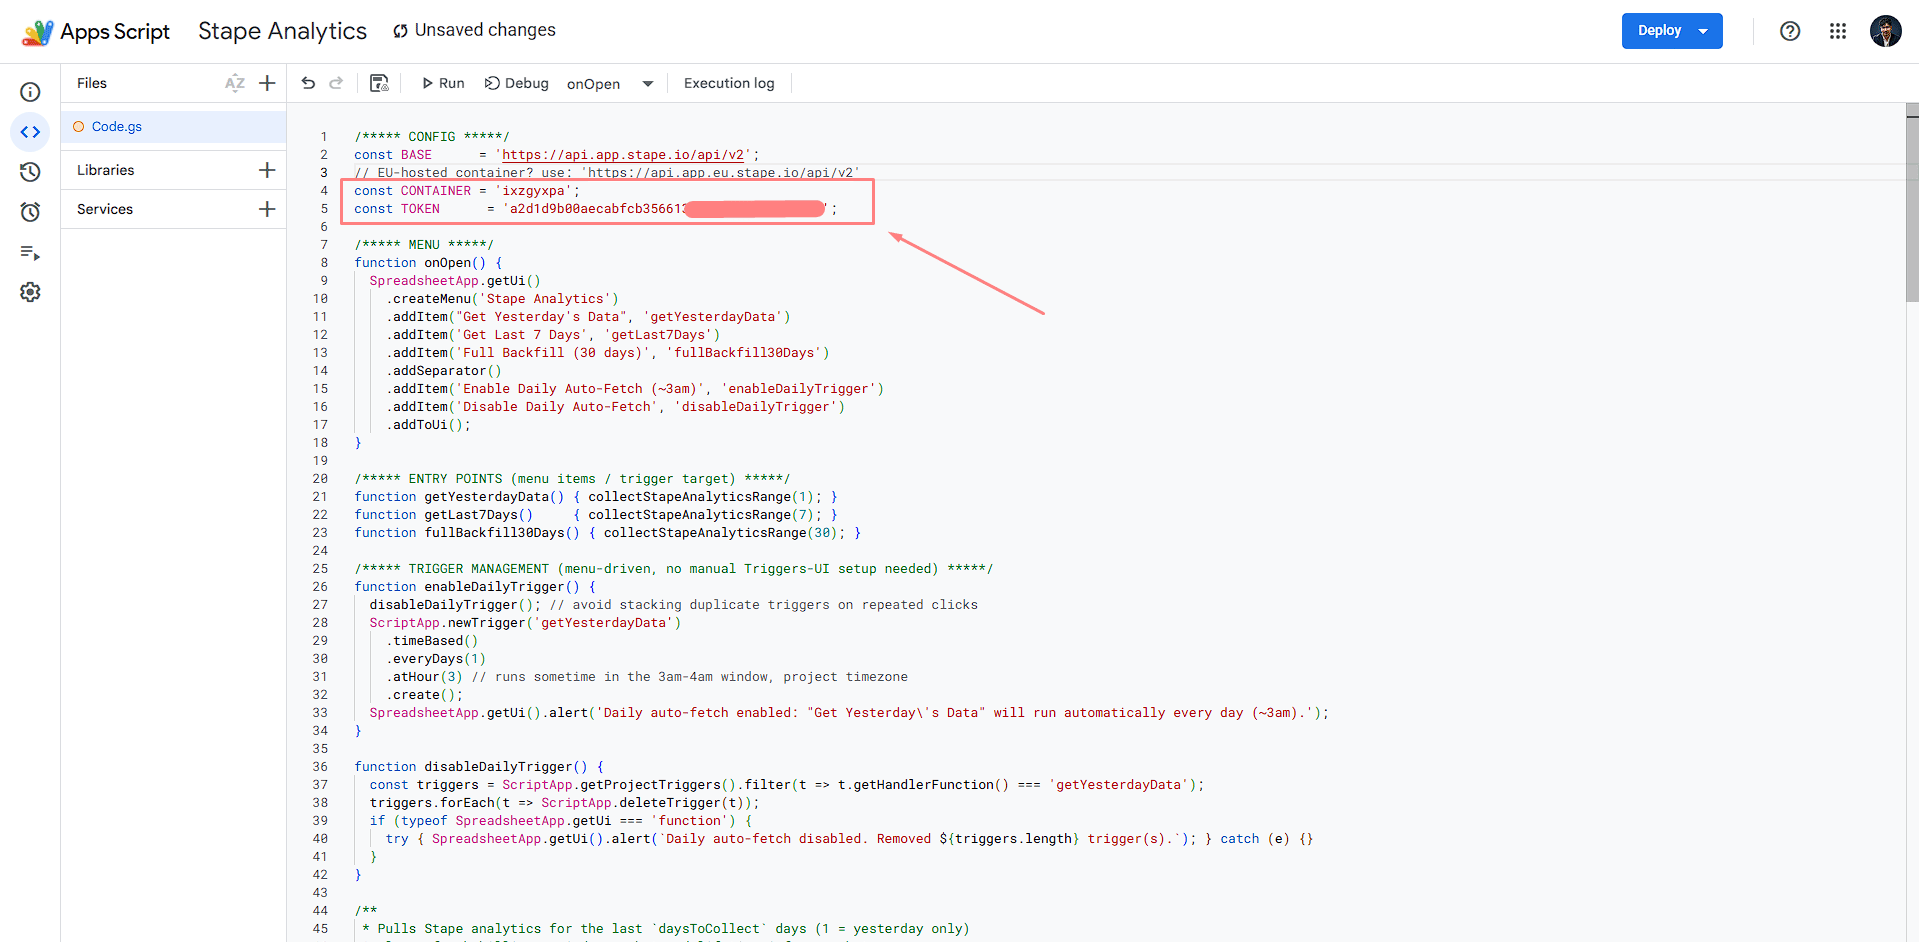
Near the top of the script:
const CONTAINER = 'your-container-identifier';
const TOKEN = 'your-api-token';
Swap in the values from Step 1. That's the only editing required.
Step 4. Run it once and approve permissions
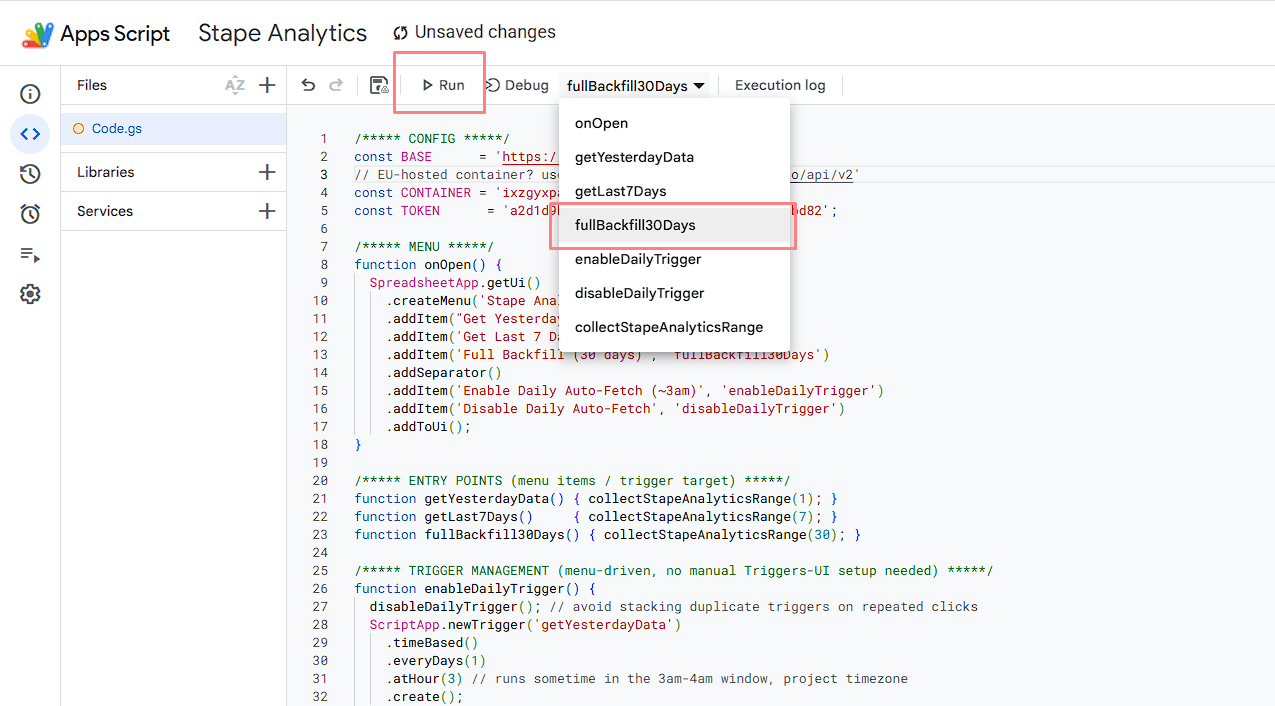
From the function dropdown, select fullBackfill30Days and click Run. Google will ask you to approve permissions the first time, since the script needs access to write into your own sheet. Approve it, and it pulls a full month of historical data on the first run.
Step 5. Use the menu
Refresh the sheet and a new Requests Analytics menu appears, with:
- Get Yesterday's Data
- Get Last 7 Days
- Full Backfill (30 days)
- Enable Daily Auto-Fetch (~3am)
- Disable Daily Auto-Fetch
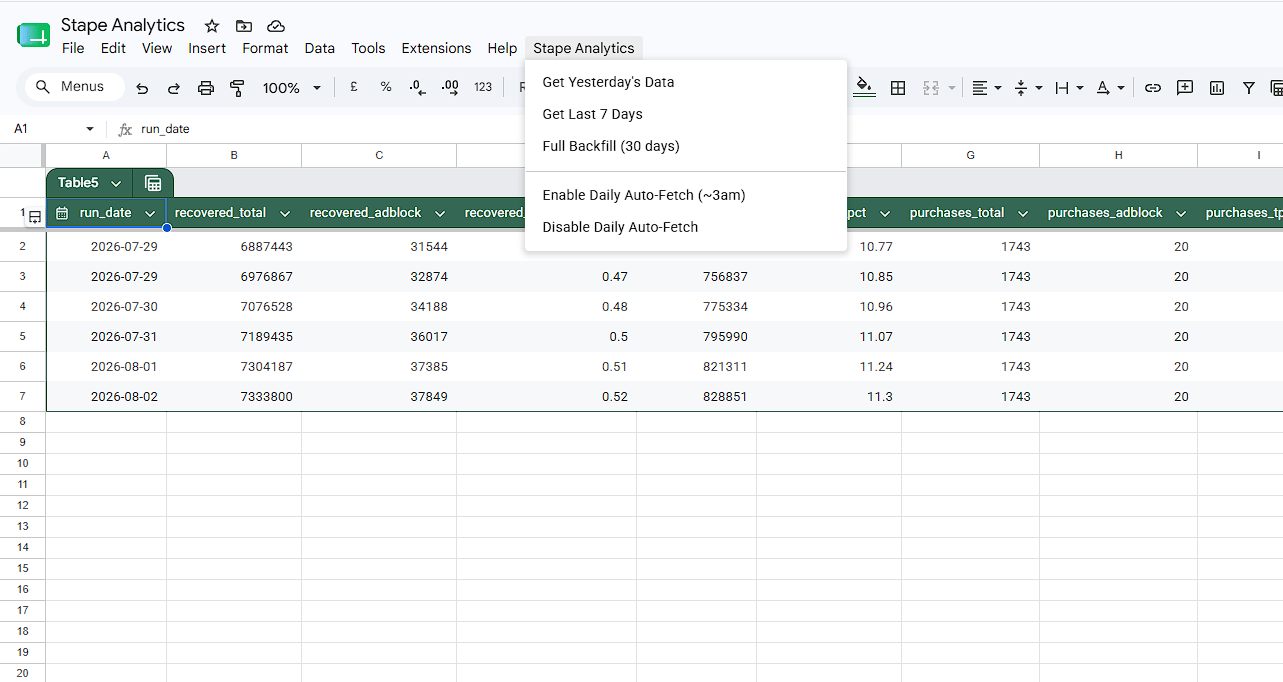
Every option is duplicate-safe – run the same range twice, and it overwrites; nothing doubles up.
Step 6. Turn on daily auto-refresh
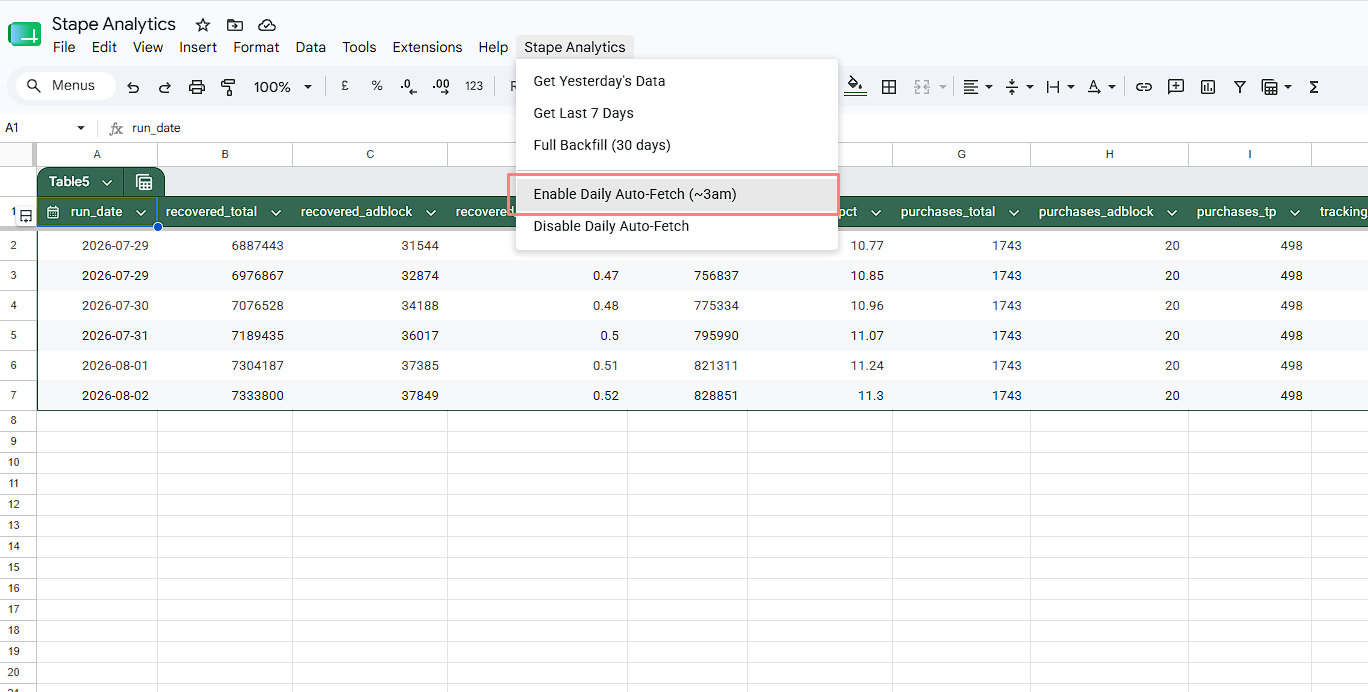
Click Enable Daily Auto-Fetch once, and a trigger is configured automatically – no need to set anything up manually in the Apps Script Triggers panel. From then on, yesterday's numbers land in the sheet every morning on their own.
What data gets saved
The sheet organizes everything into five tabs:
stape_summary– one row per day: total requests, ad-block recovery, tracking-prevention recovery, and the percentage of total traffic each represents.stape_browsers– the same metrics, scoped to each browser (Chrome, Safari, etc).stape_clients_events– the most granular tab: one row per day, per client, per event (GA4 · PageView, for example), including Consent Mode status and bot-traffic detection. This is the tab to check if a client asks something specific like "is Meta CAPI actually getting our purchase events, or just page views?" – you can filter straight toMeta CAPI · Purchaseand see the exact recovery count for that one event.stape_billing_periods– request volume by client type (GA4, GTM, Stape, Data Client, JS Libraries, Other), scoped to the current billing cycle.stape_lifetime_snapshot– a rolling recovery snapshot plus a purchase-event recovery breakdown.
Worth noting
The analytics/info endpoint behind the lifetime tab appears to return a rolling ~24-hour window rather than a true lifetime total, regardless of the date range passed to it. That's based on testing, not documentation – so treat that tab as "recent recovery" rather than "recovered to date."
Connecting it to Looker Studio
Once the data's in Sheets, add it as a data source in Looker Studio the same way you would any spreadsheet. A few things worth building from there:
- KPI cards for total recovery and ad-block recovery;
- A daily recovery trend line, split by client;
- A browser breakdown, since Safari's ITP recovery numbers are usually higher than people expect;
- A shareable dashboard link, instead of a screen-share every time someone asks.
A card showing "15.23% of traffic recovered this week, up 29.9% from last week" answers a question a lot of clients ask without knowing how to ask it: is the tracking setup actually catching what would otherwise be lost?
Here's what that looks like in practice:
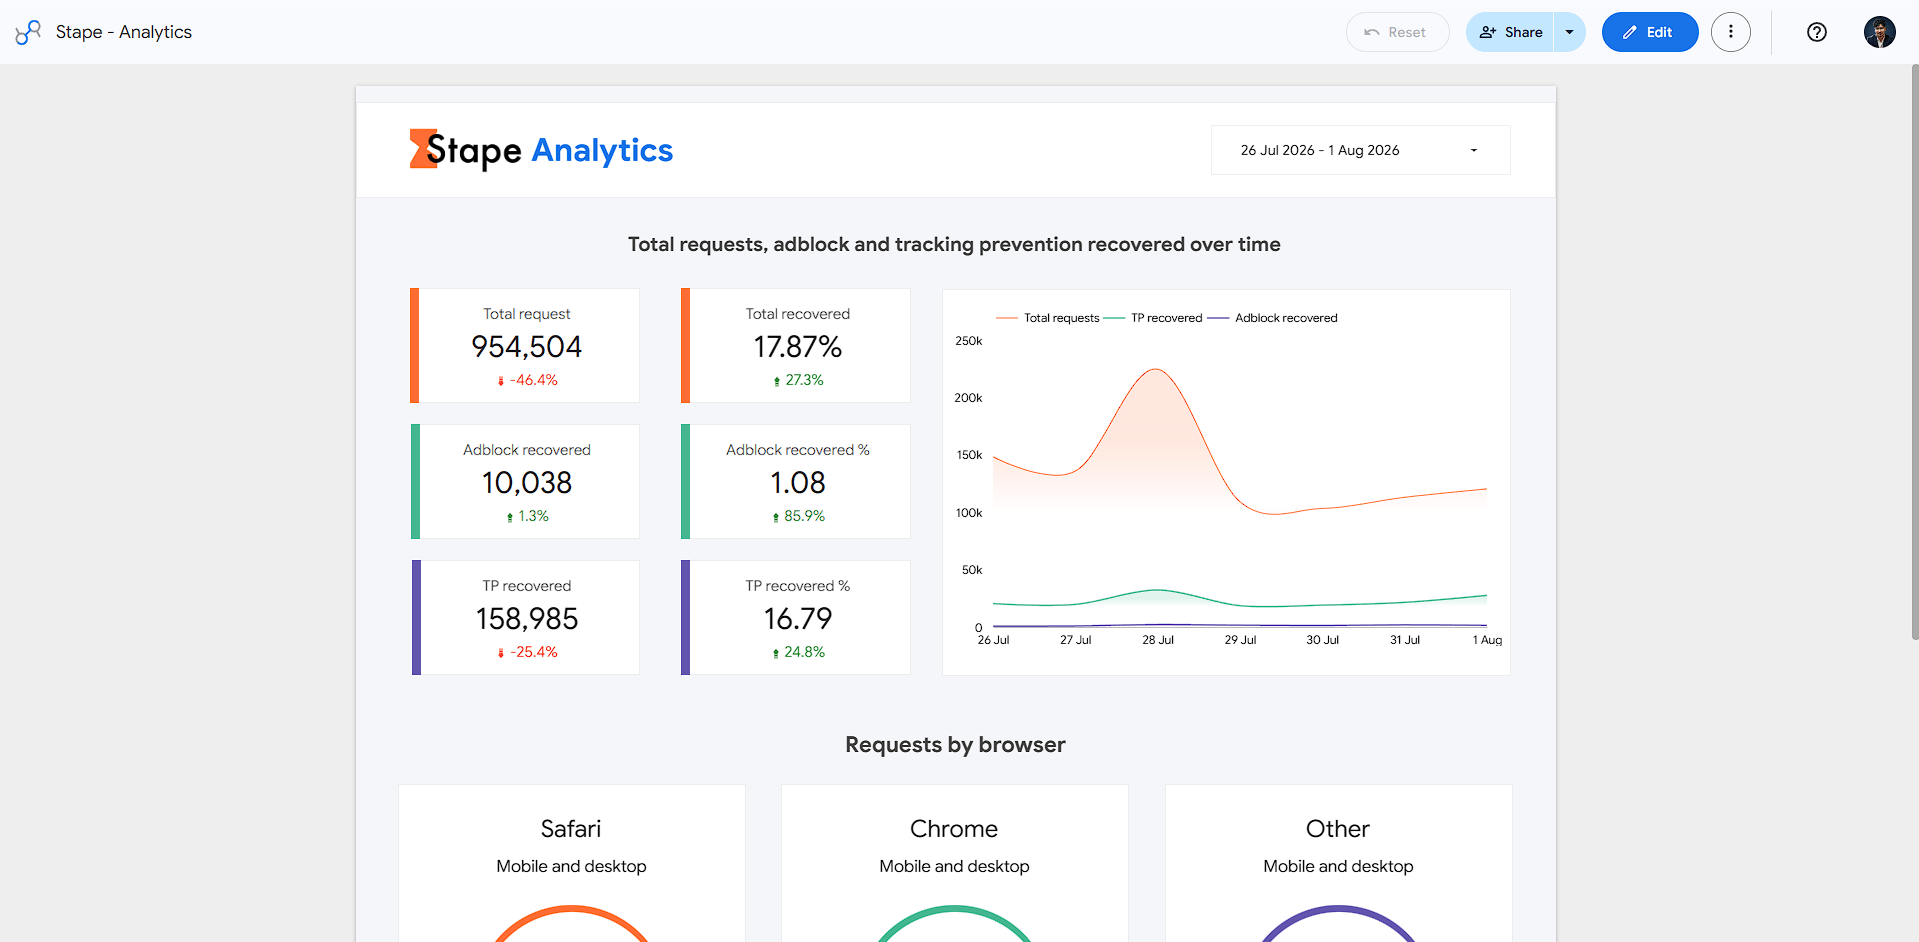
Live version here: Requests Analytics – Looker Studio dashboard
Conclusion
Server-side tracking already does the hard part – recovering traffic that would otherwise be lost. This just makes that work visible, automatically, without needing an export button that doesn't exist.
You can get the full script and setup docs on GitHub.
Want to start on the server side?
Try for freeRecommended for you
Sep 16, 2026
Blog
How to prove server-side tracking ROI to clients and stakeholders
Show server-side tracking ROI to clients with clear guardrails, before/after or A/B methods, and proof layers in Requests Analytics, GA4, and ad platforms.
Sep 30, 2026

Comments