
Requests Analytics
Requests Analytics is a free feature that visualizes how server-side tracking improves your data quality. It shows how bypassing ad blockers and browser restrictions helps you recover lost events and get more data for ad and analytics platforms.
How to access Requests Analytics
Requests Analytics is available to all Stape users. You can find it inside your Stape container in the Requests Analytics tab.
The first data appears within two days. Data appears only from the date you turn on Requests Analytics.
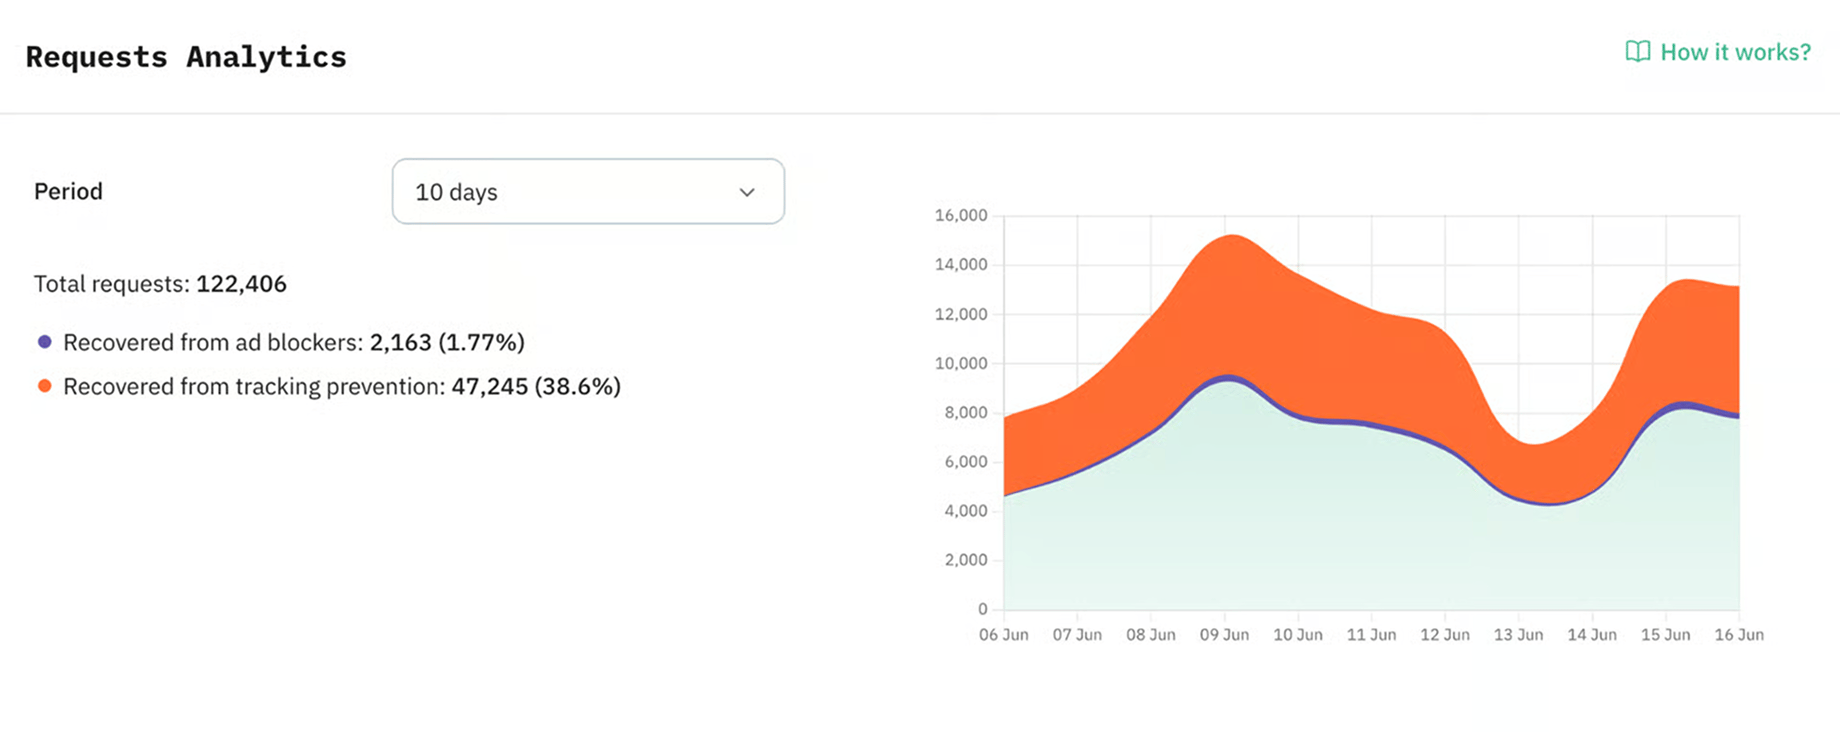
How Requests Analytics works
With Custom Loader, Requests Analytics counts the requests your website sends to your sGTM container and compares them with the requests your server-side tracking setup brings back. You can then filter this data in the dashboard by client, event name, browser, consent choice, bot traffic, or time period.
Benefits of Requests Analytics
- Measure recovered requests from ad blockers and browser restrictions. Requests Analytics shows how many requests your server-side tracking setup brings back. Use this number to see how much more complete data reaches your sGTM container.
- Check recovered requests for key events. Requests Analytics groups recovered requests by sGTM client, such as GA4 or Data Client, and by event name. This helps you see where your server-side tracking setup brings back data for important actions like purchases, leads, or signups.
- See where browser tracking protection affects your data. Requests Analytics shows which browsers visitors use and how many requests were restored for each browser. These numbers show where tracking prevention has the strongest effect on your setup.
- Separate bot requests from website activity. Bot request data shows how much non-human traffic appears in your tracking flow. This gives you a cleaner view when you review event volume and traffic quality.
- Review GA4 requests by consent status. Requests Analytics shows consent status for GA4 requests when consent parameters are available. This lets you check which events came to your sGTM container with granted, denied, or other consent values.
- Show tracking results without extra manual reports. Agencies and specialists can use the Requests Analytics dashboard to explain recovered requests, browser impact, bot activity, and consent data to clients or stakeholders.
Measure how much data your setup recovers
Use Requests Analytics to measure requests recovered from ad blockers and browser restrictions, then review the results by client, event, browser, consent status, and bot traffic.