Digital marketing analytics explained: what you need to know in 2026
Liudmyla Kharchenko
AuthorDigital marketing analytics is the process of using data from your website, ads, emails, and social media to evaluate marketing performance. It allows you to track what’s working, understand your audience, and make data-driven decisions. In 2026, marketing performance analytics will help personalize content and optimize budget allocation for better results.
What is digital marketing analytics?
Digital marketing analytics collects, analyzes, and interprets data from different digital channels to improve marketing efforts and performance. It tracks digital analytics metrics like website traffic, social media interactions, conversion rates, and customer engagement.
Data analytics marketing puts data in the center of every business decision, helping companies base their strategies on concrete evidence.
By understanding user behavior and patterns, marketers can improve their strategies, create personalized customer experiences, and distribute resources better. Simply put, marketers can see right away what works and what doesn’t on the go, allowing them to make quicker adjustments, smarter decisions, and create more impactful campaigns.
Based on digital marketing insights, such an approach allows businesses to make smarter and safer decisions, improving return on investment and driving growth.
| See exactly what’s being tracked and improve your analytics – use Stape’s free Website Tracking Checker now! The tool shows you how well your digital marketing tracking aligns with modern best practices and highlights opportunities to improve data quality for your analytics systems and ad platforms. Digital marketers and agencies can run fast tracking audits, use the report as a checklist to double-check implementations, and win more clients with proof of server-side tracking value. |
Benefits of analytics in digital marketing
How exactly does digital marketing analysis help with marketing? Let’s explore some of the key benefits now.
1. Make informed decisions
Digital marketing analytics allows marketers to make well-informed decisions based on solid facts. The data-driven approach removes the guesswork from marketing, leading the way for effective and precise strategies.
2. Understand consumer behavior
One of the significant benefits of online marketing analytics is that it gives marketers a clear understanding of consumer behavior. Marketers analyze customer data and can gain insights into what marketing efforts led to purchases or other targeted conversions. For instance, Spotify analyses users' listening history, liked songs, skipped tracks, and playlist preferences to create personalized playlists. This keeps users engaged, increases listening time, and boosts subscription retention. Read more about Spotify ads to see how the platform's first-party data can work for advertisers.
3. Optimize marketing campaigns
Data analytics lets marketers monitor and evaluate the effectiveness of their marketing campaigns in real time. Marketers analyze click-through, engagement, and conversion rates, and it helps them to focus on campaigns that bring better results and optimize those lagging behind.
4. Personalization
Data analytics in digital marketing helps marketers polish personalization. Customer data is used to target specific user groups, predict behaviors, and deliver tailored content, improving customer engagement and experience.
5. Competitive analysis
Digital market analysis is a good tool for insights into market trends and competitor activities. It allows marketers to analyze competitor website traffic and social media engagement to identify opportunities for outrunning the competitors.
6. ROI measurement
With the help of data analytics, marketers can measure the return on investment of their marketing campaigns. It can help determine which campaigns generated the highest ROI and adjust strategies accordingly.
7. Improve customer retention
By analyzing customers' behavior, engagement, and purchase patterns, marketers can identify areas for improvement in customer service and retention strategies. With the help of analytics, businesses can understand the needs of their customers and tailor their offerings to these needs. Solid data from the analytics helps marketers create loyalty programs, targeted content, or personalized offers that increase customer retention and lifetime value.
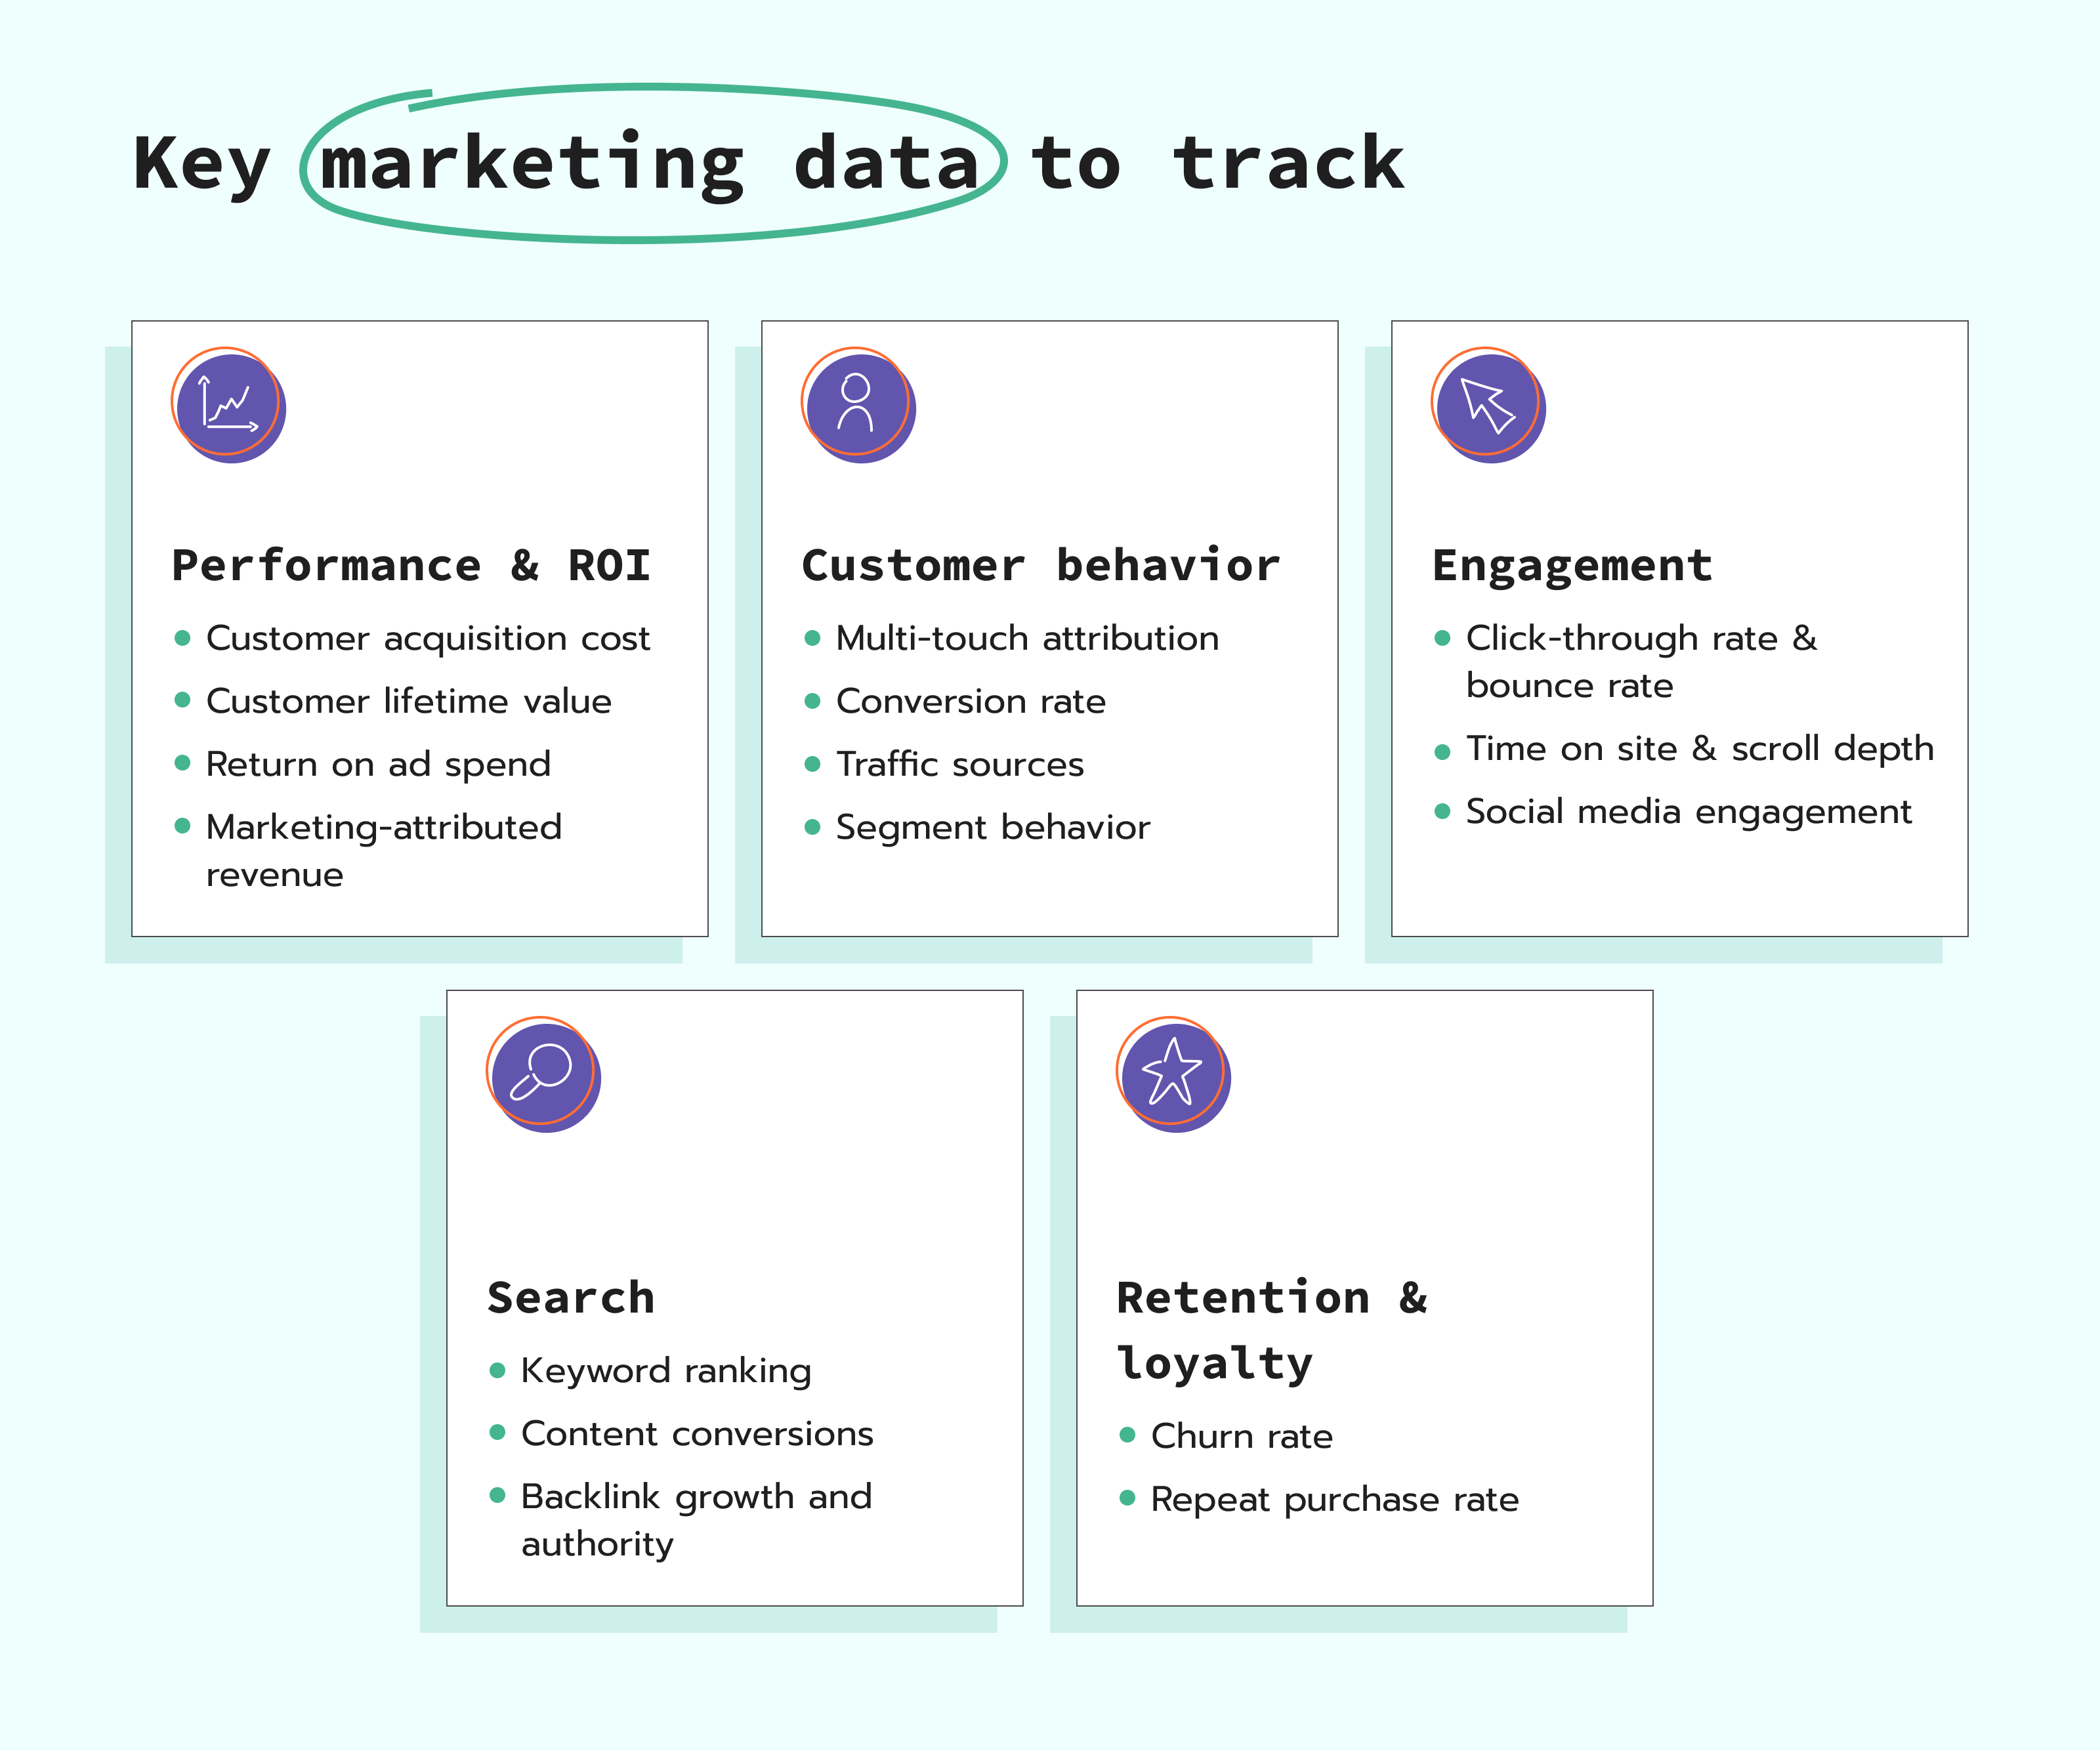
Key marketing data to track in 2026
Understanding which marketing metrics matter most in 2026 can help businesses distribute resources wisely and optimize every step of the marketing customer journey.
Performance and ROI
If you can’t tie your efforts to revenue, what’s the point of spending time and resources on them? Take a look at what to focus on:
- Customer acquisition cost is to always know what it takes to get a customer.
- Customer lifetime value is used to understand what the customer is worth long term and what profit they bring.
- Return on ad spend to see how your money is working for you. Use a ROAS calculator to estimate how server-side tracking could improve your results.
- Marketing-attributed revenue to see whether your campaigns work well enough for you or whether you should take a pivot fast.
Customer behavior
In the current digitalized environment, we no longer market for people, we market with them. It's about engaging with your audience, creating interactions, and building relationships. Marketers now work alongside consumers, gathering their feedback, preferences, and insights to tailor products and services that meet their needs. Metrics to focus on when monitoring customer behavior are as follows:
- Multi-touch attribution. People don’t move through funnels like it's 2010. They don't see ads, click, and buy in a perfect sequence. Customers don’t follow straight lines of a pre-determined funnel, and you must think creatively to follow their journey. You must map multiple touchpoints and use web marketing analytics to see the full picture.
- Conversion rate. You need these metrics to evaluate the quality of your efforts, such as how well your ads are bringing in the right audience who take the desired actions. Conversion rate helps assess whether the traffic you’ve attracted is genuinely interested and likely to complete your goal, like making a purchase or signing up.
- Traffic sources. You need to monitor each traffic source, as organic, paid, and referral each tells a different story.
- Segment behavior. Segmentation helps you provide tailored experiences to the high-value customers. Also, it can help you build lasting loyalty.
Engagement
Track engagement that shows genuine interest - like clicks, reactions, and time spent. Things to focus on here:
- Click-through rate and bounce rate. Low bounce and high click-through rates mean you show your customers exactly what they want.
- Time on site and scroll depth. If users don’t stay on your page or don’t scroll through it, your content and how you present it probably need to be tuned up.
- Social media engagement. It shows how users interact with your content, including likes, shares, comments, and other forms of participation.
Search
They say content is king. Search is its kingdom. To see whether people looking for what you offer can find you, track the following:
- Keyword ranking. In a noisy digital world, you must watch your strategic terms and rank high with them.
- Content conversions. Monitor how users act on content they read and whether your content inspires action.
- Backlink growth and authority. Track how quality backlinks grow your credibility and visibility across search platforms.
Retention and loyalty
New customers are gold, but lasting loyal customers are priceless. Tracking the following metrics is a must:
- Churn rate. Investigate where, how, and why you lose customers and how you can fix it.
- Repeat purchase rate. Track what inspires people to return to you and how you keep that inspiration going.
Brand mentions
Building your brand is a marathon, so you must always keep track of your vitals. In this case, the vitals are:
- Social mentions. Monitor how many people are talking about your business, but also what they are saying. Follow the tone of the narration.
- Review data. What your customers say without expecting you to see it is the most honest reviews you can get. Usually, much space for growth can be found there.
- Share of voice with competitors. Check whether you are leading the game or only participating in it, and how you can change that.
All in all, it all comes down to tracking data that can help you make profitable decisions. Digital marketing data analysis is the compass that enables you to find the right way through campaigns, content, budget allocation, and strategy.
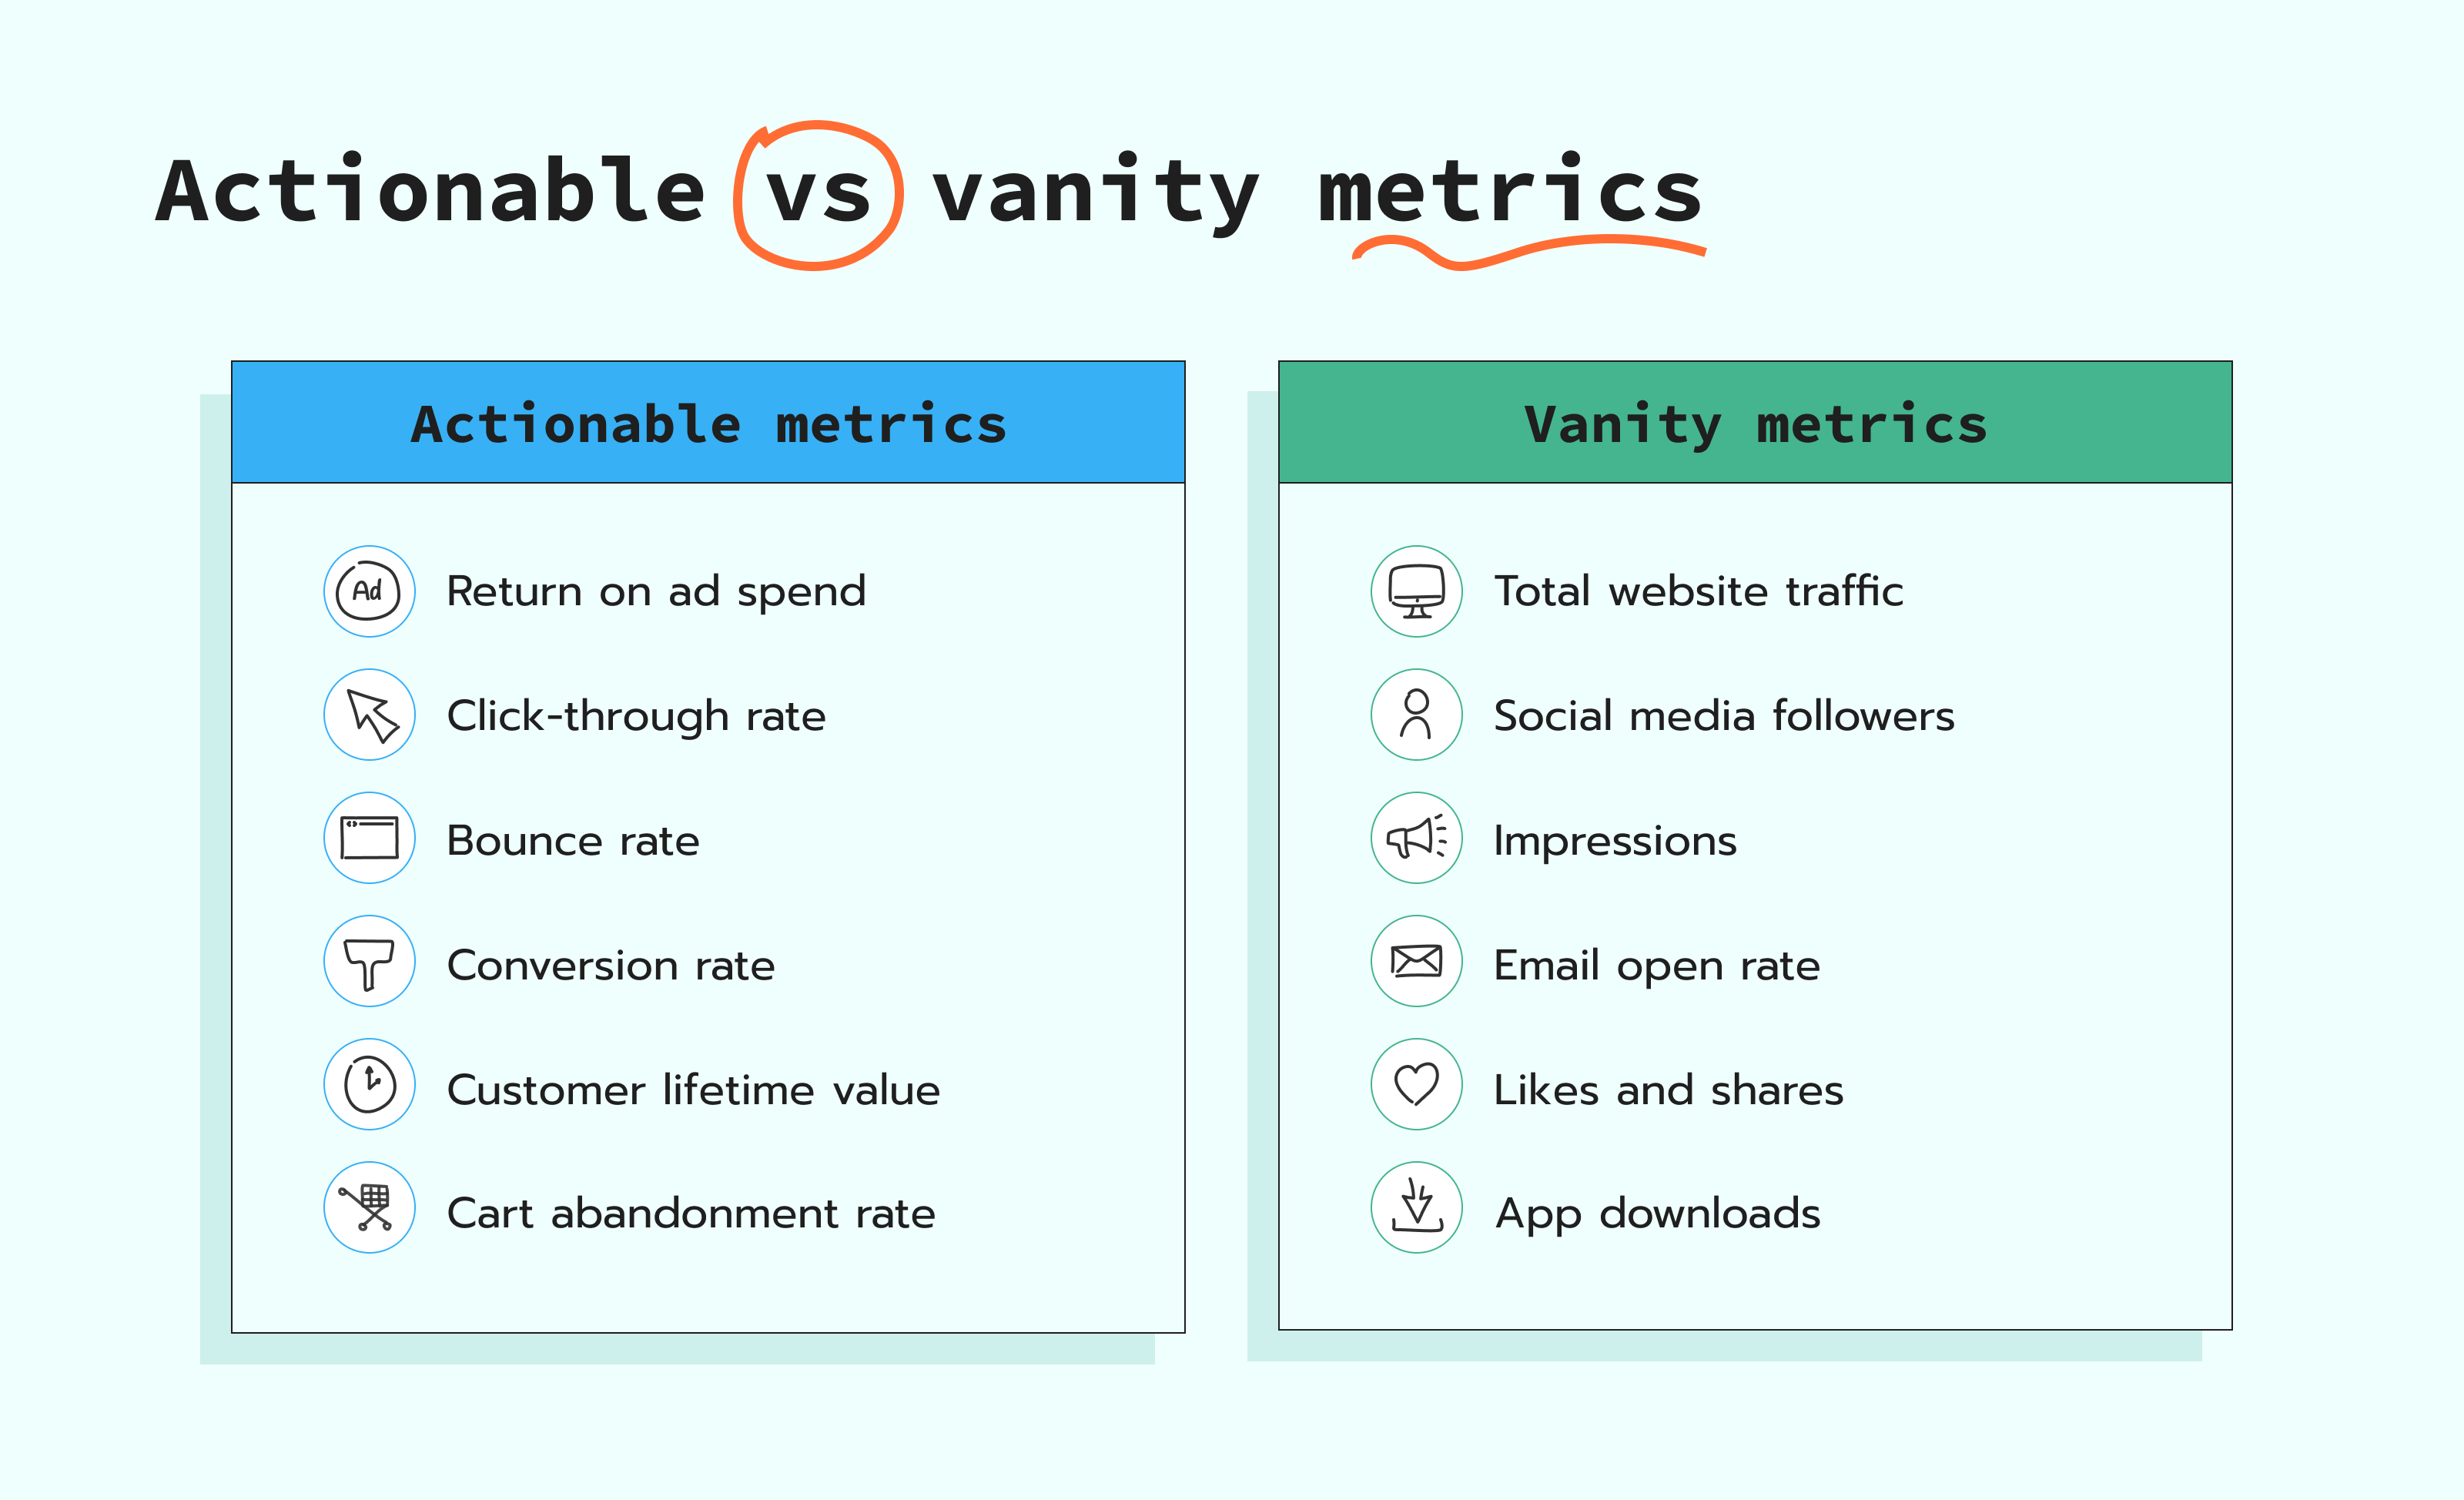
Actionable vs vanity metrics
Another point we should discuss is the difference between actionable and vanity metrics, and which one you should focus on.
The short answer is to focus on actionable metrics. While vanity metrics can be appealing, they can be pretty misleading. To make your marketing efforts successful, you need to understand the difference between vanity metrics and actionable metrics clearly.
So, let’s break it down now.
Vanity metrics look impressive on the outside but don’t result in any significant business results. Vanity metrics usually are misleading, do not have any substance to them, do not lead to business or product improvement, and do not give you any context. For instance, if you get 10,000 subscribers on Instagram, it could look impressive, but it doesn’t change anything for you if you still have a hundred paying customers.
Examples of vanity metrics:
- Total website traffic
- Social media followers
- Page views
- Impressions
- Email open rate
- Likes and shares
- App downloads
Actionable metrics, on the contrary, are metrics that show how your marketing efforts are performing. These metrics are directly tied to results, so they help you focus on what truly matters, make better decisions, and keep your team working towards goals that grow your business.
Examples of actionable metrics:
- Return on ad spend
- Click-through rate
- Bounce rate
- Customer acquisition cost
- Conversion rate
- Customer lifetime value
- Cart abandonment rate
- Social media engagement rate
Expert overview of marketing data analytics tools
The most popular and effective internet marketing analytics tools currently available and most widely used by marketers are:
Google Analytics
Google Analytics is a tool that tracks and reports data from your website or app to provide insights into user behavior. Adding a small JavaScript code to your pages helps collect user interaction data, such as device type, browser, language, and traffic source. This data is then sent to Google Analytics, processed, and organized based on criteria like device type or traffic source, with options to apply filters (e.g., exclude internal traffic). The processed data is stored in reports, helping businesses analyze performance and make data-driven decisions.
Best for website performance tracking, behavior analysis, and conversion tracking.
- With Stape, you can configure server-side Google Analytics and Google Ads in minutes.
HubSpot
This inbound marketing software combines CRM, email marketing, content management, and analytics. It lets you track lead generation, conversion, and customer lifecycle metrics, making it easier to personalize campaigns.
Best for inbound marketing campaigns, lead nurturing, and automation.
- Stape has a HubSpot tag that allows you to connect your site with HubSpot using server-side tracking.
SEMrush
A tool for search engine optimization, SEMrush tracks keyword rankings, backlink growth, and competitor analysis. It also provides data on paid search campaigns and allows you to monitor how well your content performs in search results.
Best for SEO performance, competitor analysis, and keyword research.
Adobe Analytics
A high-end tool that provides advanced customer insights and real-time analytics. It integrates with Adobe’s suite of products (e.g., Adobe Experience Cloud) and helps track customer behavior across websites, apps, and social media.
Best for multi-channel tracking, advanced customer segmentation, and real-time insights.
Tableau
Tableau is a data visualization tool that allows you to create interactive dashboards to analyze marketing data from multiple sources. It’s great for spotting trends, monitoring key performance indicators, and sharing insights across teams.
Best for data visualization and creating custom, easy-to-understand reports.
Of course, there are many more tools to choose from, feel free to explore and find a solution that fits you best.
| Related: Improve your analytics accuracy with server-side tracking using Matomo Google Tag Manager. |
How and where to get marketing data?
You can collect marketing data from many sources, such as your website, mobile apps, email campaigns, social media platforms, paid ads and offline data.
Most of the data you collect comes through tracking tools like Google Analytics, ad platforms like Meta or Google Ads, CRM systems, and heatmaps.
Many marketers turn to server-side tracking to make their tracking more accurate and privacy-friendly. Compared to traditional client-side tracking, it sends data directly from your server to the analytics platform. This way of tracking data is more reliable in the context of tightening data regulations and omnipresent tracking restrictions and ad blockers.
10 main analytics reports for marketers
Every marketer should know the following main analytics reports that are standard in Google Analytics 4, and are also present in most of the other marketing platforms:
| 1 | User acquisition | Find out how new visitors discover your site for the first time. It’s perfect for evaluating which campaigns drive first-time traffic. |
| 2 | Traffic acquisition | See where all sessions come from (not just new users) and compare performance across search, social, and direct sources. |
| 3 | Pages & screens | Identify your most visited content and see how users interact with key pages or app screens. |
| 4 | E-commerce purchases | Track what products are being bought, average order value, and customer behavior across the purchase funnel. |
| 5 | Landing pages | Understand which entry pages drive engagement or lead to high bounce rates — critical for optimizing campaigns. |
| 6 | Funnel exploration | Create custom funnels to track user drop-offs and pinpoint where your leads or shoppers are getting stuck. |
| 7 | Path exploration | Visualize how users navigate your site step-by-step and uncover surprising patterns or dead ends. |
| 8 | Retention report | See how often users return, how long they stick around, and what content or features keep them returning. |
| 9 | User lifetime | Measure long-term value and engagement per user, helping you focus marketing on high-ROI audiences. |
| 10 | Segment overlap | Compare behaviors across user groups and find shared traits to sharpen targeting and messaging. |
Data analytics trends in digital marketing
Data trends in digital marketing for 2026 that you should know about:
1. First-party data takes over. With growing privacy concerns and stricter regulations, first-party data tracking is now the go-to method. Tools like Google's first-party mode make it easier to collect data directly from users, improving the accuracy and reliability of your tracking. This leads to better data quality, which ultimately boosts your ROI.
2. Easier offline data integration. Offline conversions are gaining importance. Platforms like Customer Data Platforms help merge offline and online data. You can invest in a ready-made CDP or build one using GTM server hosting.
3. Rising data processing costs. The demand for AI and cloud services drives up server and storage costs. This is one of the marketing analytics trends that is expected to continue as data needs grow.
4. Growing focus on user trust. High-profile antitrust cases and increased user awareness mean businesses must be transparent about data collection. Consent tools like Google’s Consent Mode V2 and Microsoft Clarity help improve user trust.
5. AI & ML in Analytics. AI and machine learning reshape analytics, offering more intelligent insights and performance predictions. However, their success depends on having robust, well-integrated data sources.
Challenges in digital marketing analytics and how to overcome them
Main challenges in digital marketing analytics you should know about in 2026:
1. Evolving tracking prevention. Browsers and ad blockers are constantly upgrading. Chrome’s shift to Manifest V3 limits ad blocker power, while Safari’s ITP and Incognito mode restrict cookie use and data storage, making user tracking more difficult.
2. Stricter data privacy laws. Regulations like GDPR, DORA, and PDPL raise the bar for data compliance. It’s becoming harder to collect user data while staying compliant.
3. Server-side tracking sounds complex. It sounds like something only developers and big tech teams can handle. New infrastructure, code, legal compliance… overwhelming, right?
But here’s the truth: it doesn’t have to be. Check out Stape Academy and see how simple it is. With the right tools, setting up server-side tracking is easier than ever and gives you back control over your data. You can try server-side tracking for free today with Stape.
Evolution of digital marketing analytics
Early to mid-1990s
Digital marketing analytics started with basic website tracking and email campaigns. Customer data was scarce, and tools to manage it were underdeveloped. Data privacy and security concerns grew alongside the rise of data collection almost immediately.
Early 2000s
With the emergence of social media, data analytics for digital marketing took another level. For a long time, though, data remained fragmented and isolated, and marketers couldn't get a complete picture of a customer's journey.
2010s
The rapid takeover of smartphones, social media platforms, and cloud-based tools gave marketers access to more detailed and actionable insights than ever before. Tracking shifted from simple metrics like page views to full user journeys, conversion funnels, and cross-platform engagement. Big data analytics, personalization, and marketing automation became standard.
2020s
The 2020s began with the COVID-19 pandemic. As physical stores closed, marketers had to adapt to a massive digital shift immediately. With more data flowing from various channels, machine learning and AI have become essential, enabling marketers to access predictive analytics, real-time personalization, and automated customer journeys.
Here and now: mid-2000s
Customers expect a personalized, uninterrupted experience across channels and platforms. Server-side tracking has become much more popular, as brands look for more secure ways to collect data while respecting user privacy. The most successful brands use data responsibly, offering real value and building user trust through transparency.
FAQ
How do AI and machine learning enhance marketing analytics?
AI and machine learning turn massive amounts of raw data into real-time insights. They can predict customer behavior, help you personalize experiences, and automate decisions faster than humans ever could. In 2026, AI and ML don’t simply analyze what happened; they predict what’s coming next and do it well. They can forecast customer churn, purchase intent, product demand, lifetime value, and many more things you want to know as a marketer.
How can businesses accurately measure cross-channel and cross-device performance?
Accurate cross-channel and cross-device tracking starts with clean data. You need to set up your UTM parameters well, use event-based tracking correctly, and bridge the gaps with server-side tracking. You can use attribution platforms to stitch sessions from different devices together.
What is data visualization in digital marketing?
Data visualization trends in digital marketing are all about making complex data clear instantly. From real-time dashboards to interactive charts, created by AI and ML, these visualizations help markets spot patterns, compare the performance of different strategies, and make data-driven decisions fast.
Want to start on server-side?
We are happy to hear that! Click on Try for free to register and check all the possibilities.

Comments