Step 5. Test and preview sGTM configuration
Updated Jun 26, 2026
Debugging and monitoring are essential for a successful server-side tracking implementation.
1. Open preview mode in web and server containers.
- Go to Google Tag Manager.
- Open your server GTM container → click Preview.
- In a different browser tab, open your web GTM container → click Preview → enter your website’s URL.
This will start the web debug session. Your website will open in a new window with the GTM debug panel active at the bottom.
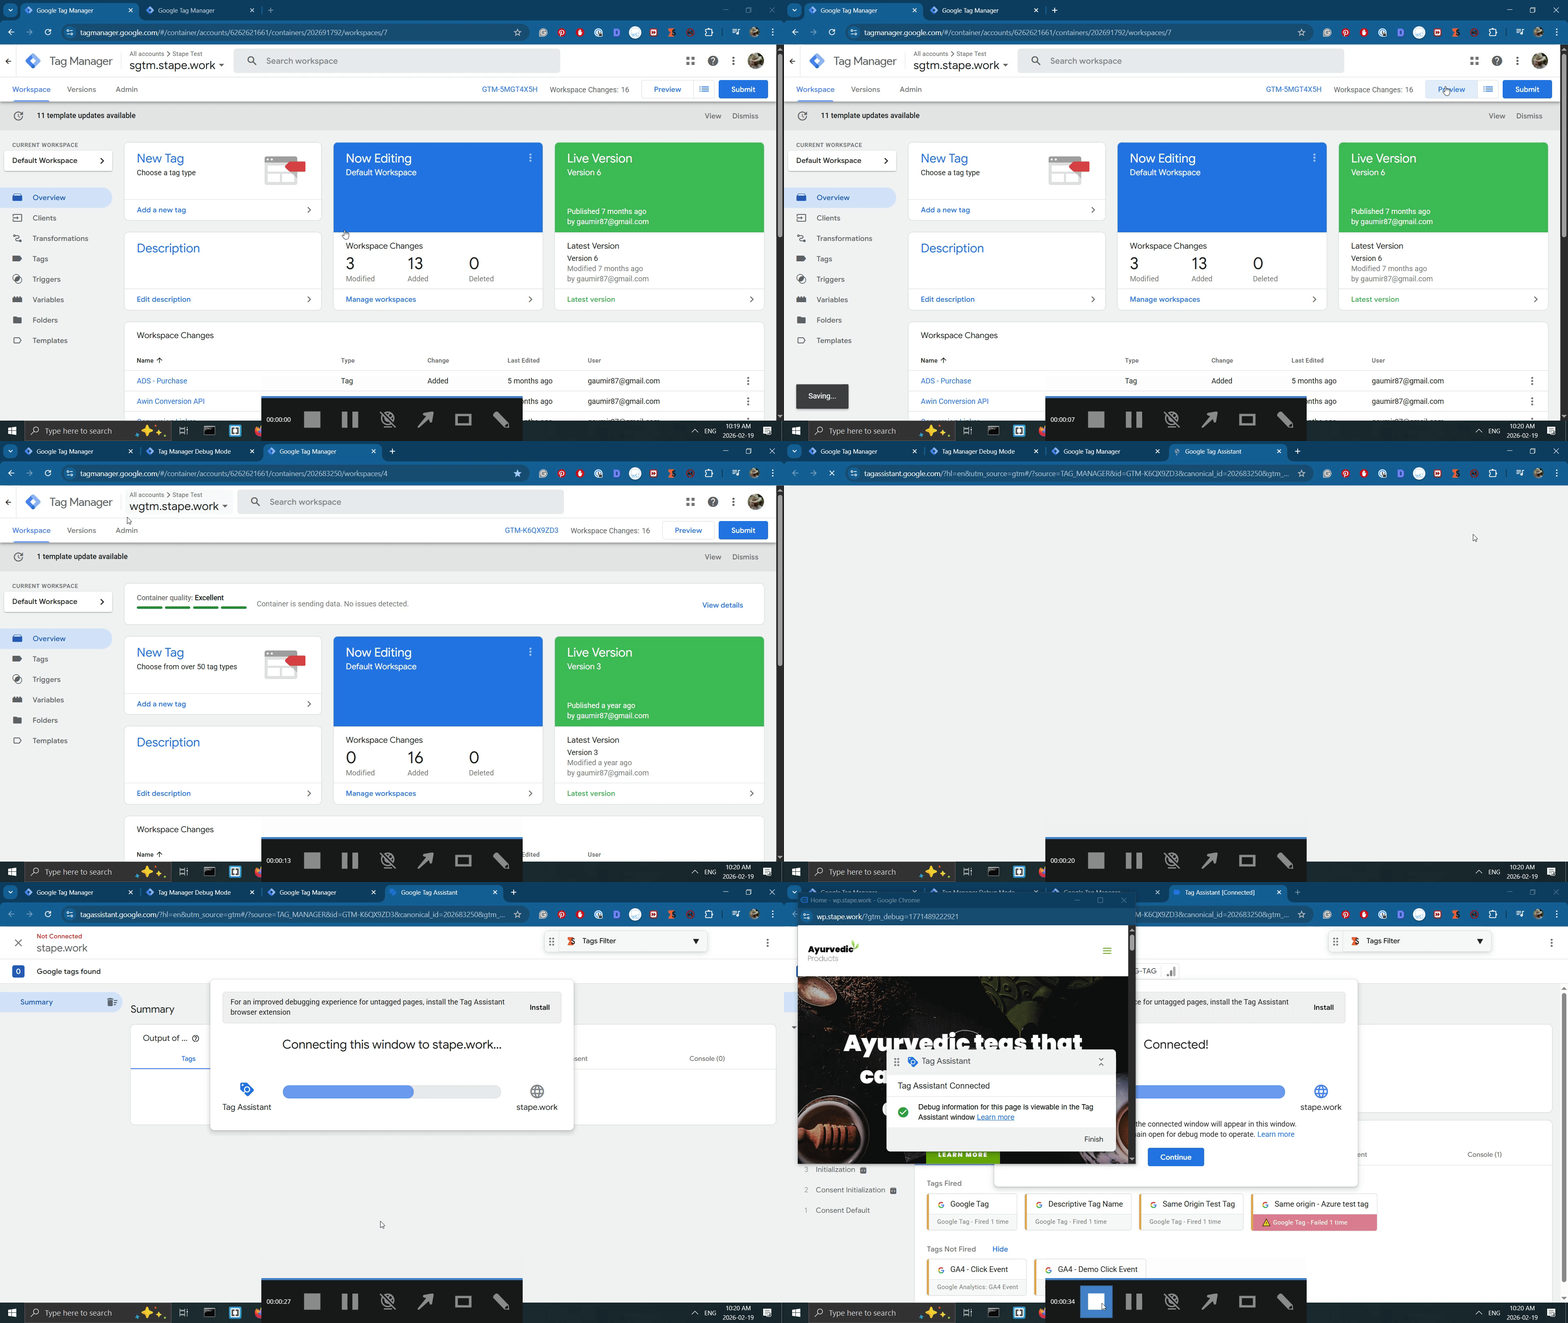
2. Trigger a request from your website.
- Perform actions that trigger tags. By simply loading the page, you’ve triggered the page_view event. Other simple possible actions include reloading the page or clicking a button. Such events will show in your debugger.
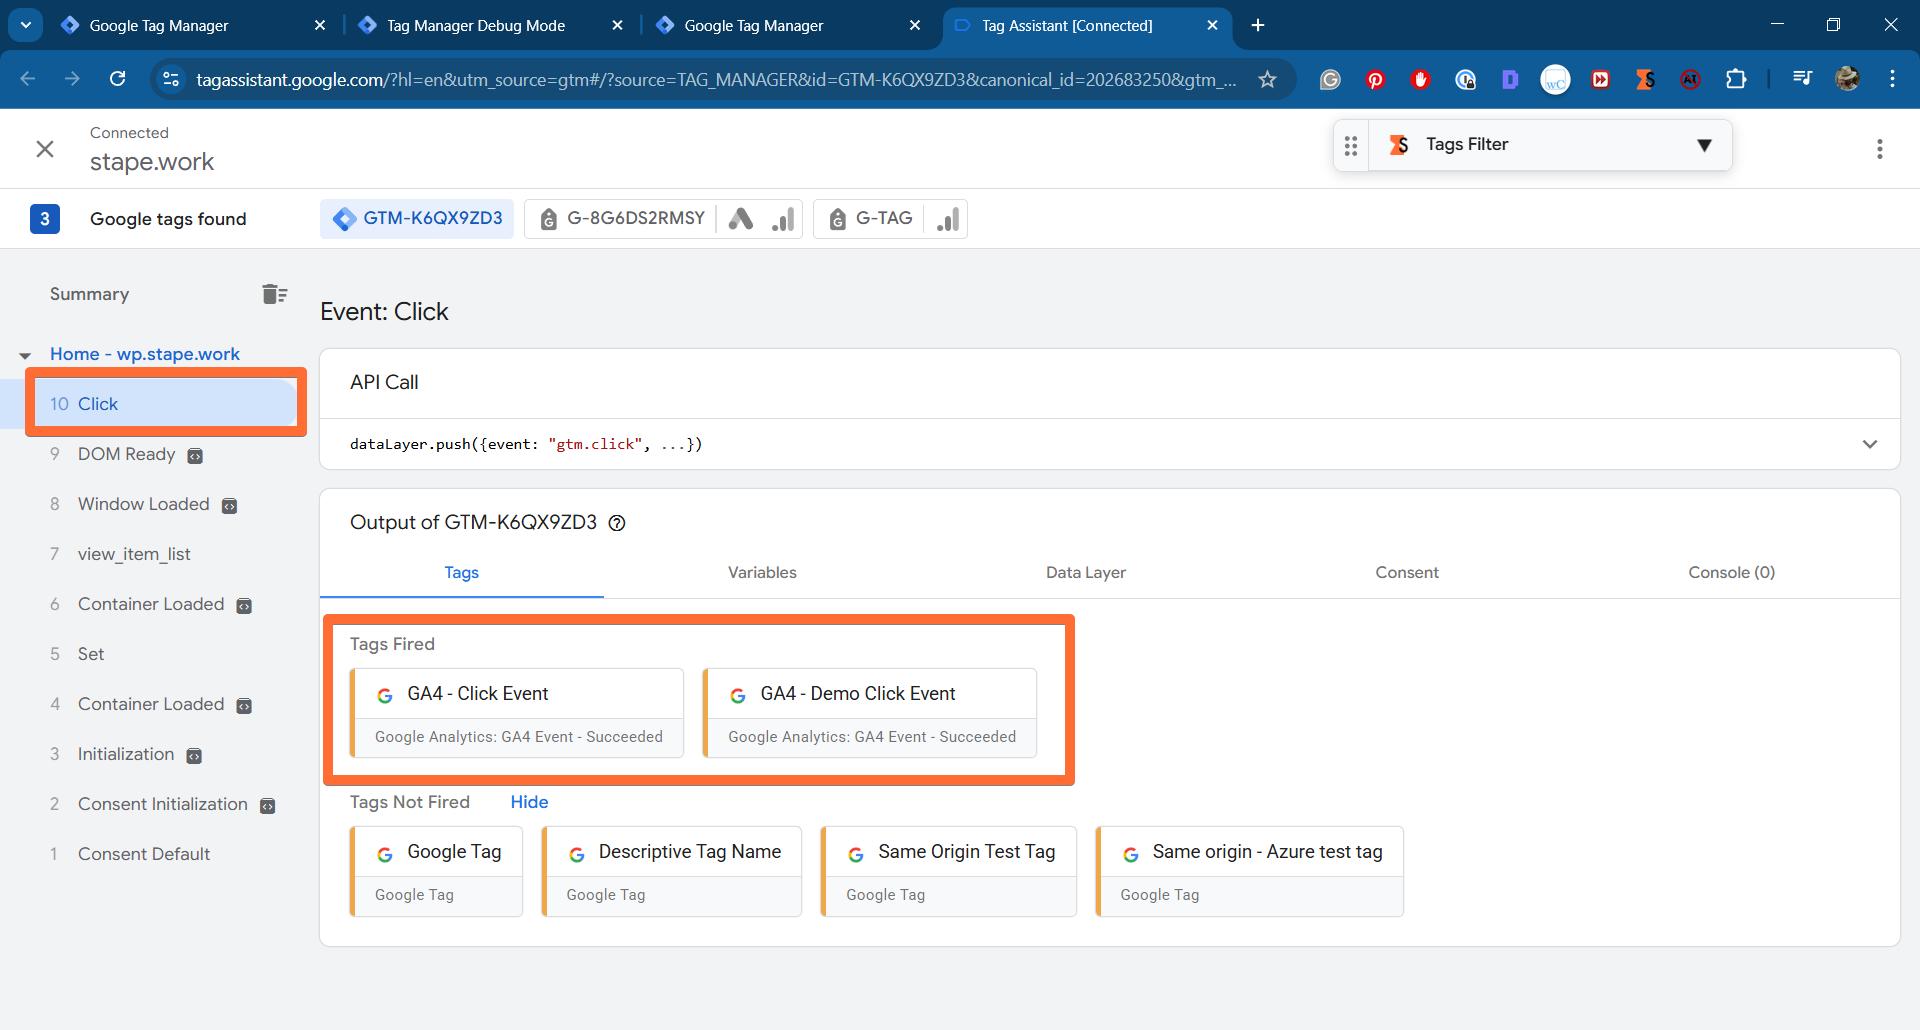
- In web GTM Preview, click on the event. Under Tags Fired, find the tag you configured to send data to your server (e.g., Google Analytics 4 tag). If it fired, it means a request was successfully sent to your server container.
3. Check incoming requests in the server GTM Preview.
- Go back to the server GTM Preview tab you opened in the first step.
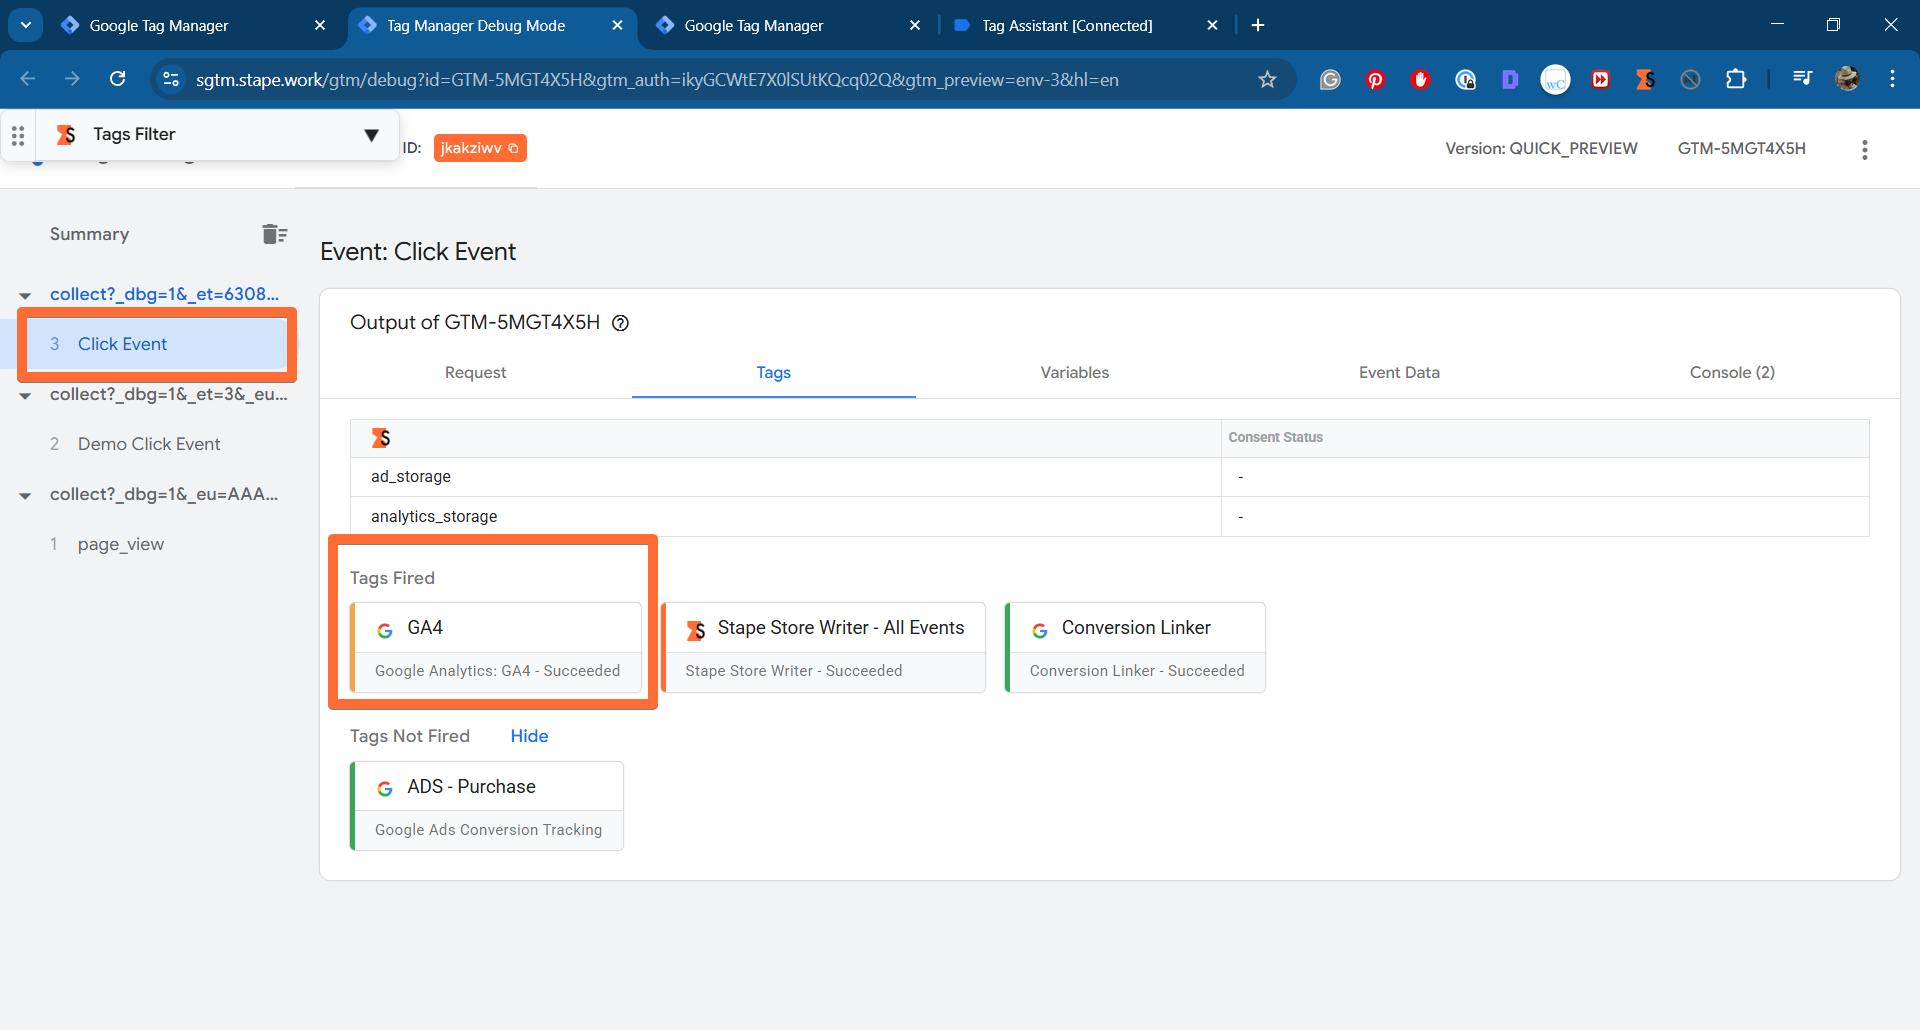
- If you see events coming from your website domain, the setup works and requests are successfully reaching your sGTM container hosted on Stape.
- Click on the incoming request. Check the Tags Fired tab to see that your server-side tags (like the GA4 tag) have activated.
- In the fired tag, check the Outgoing HTTP Requests tab to see the request that your server container successfully sent to Google Analytics.
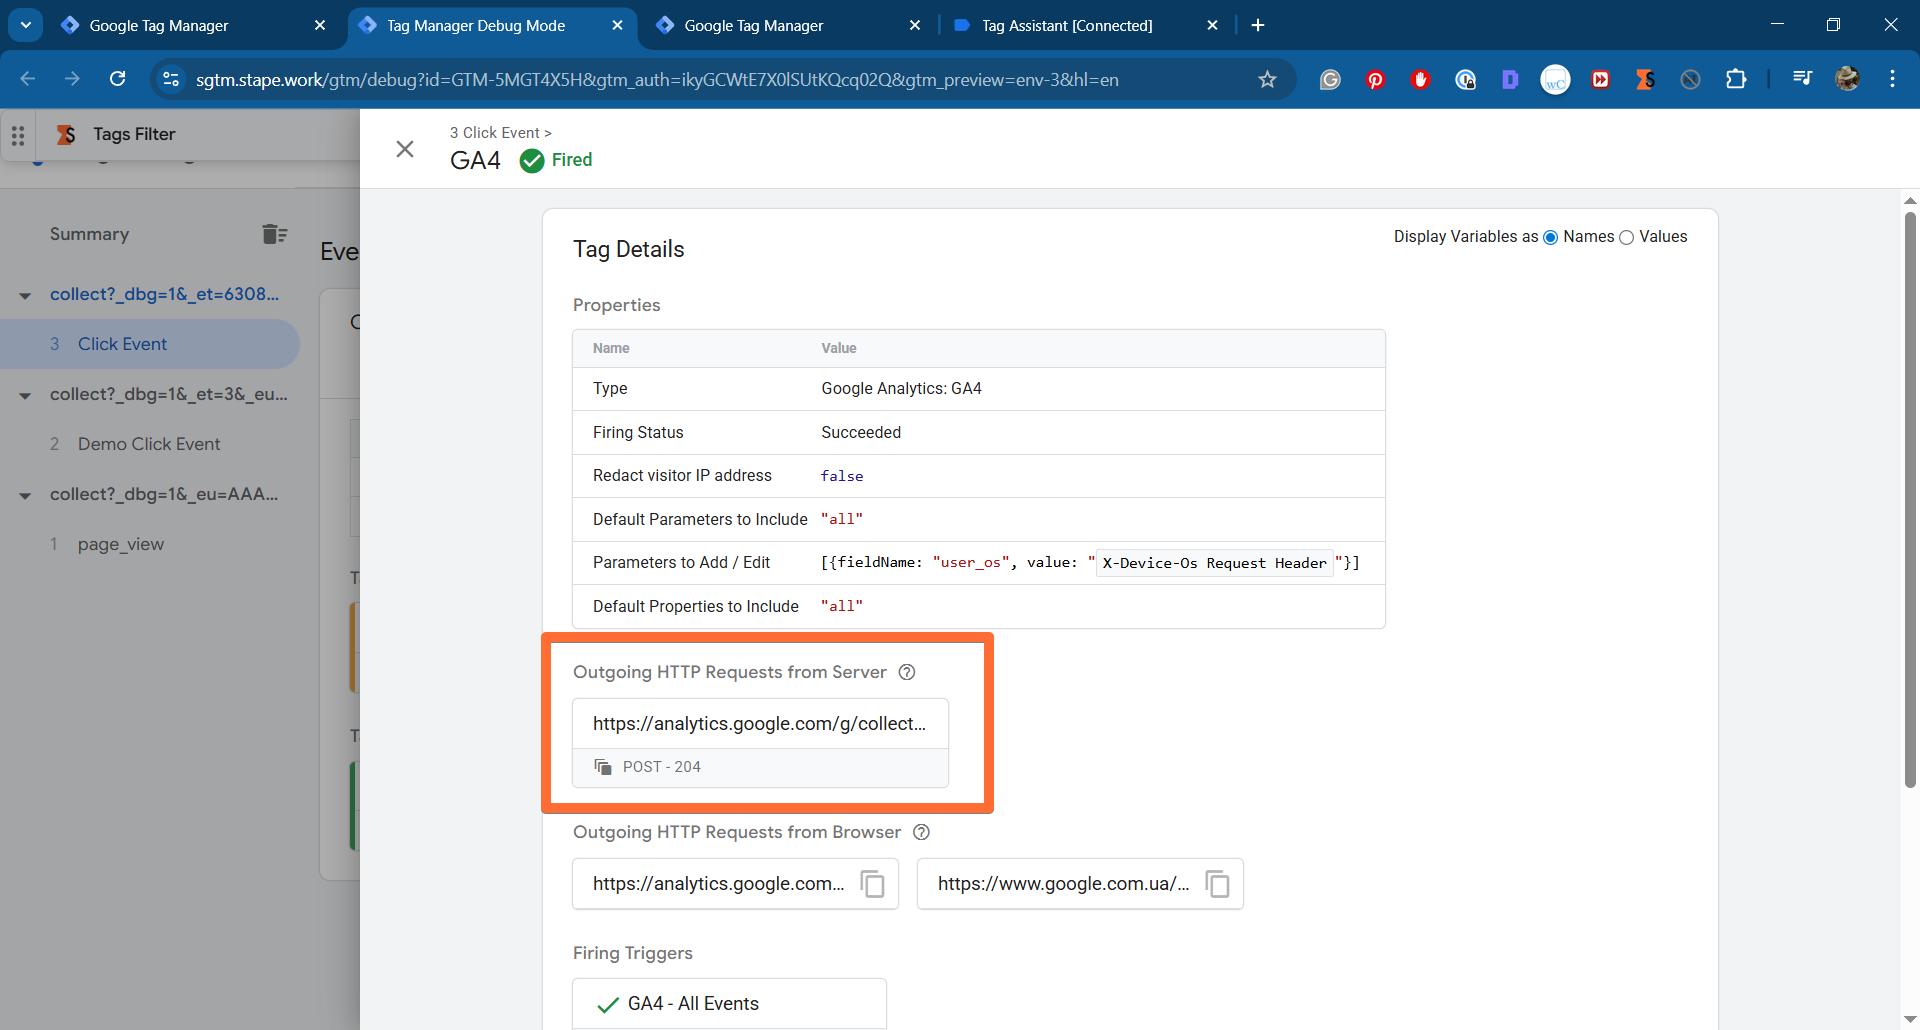
If you see that outgoing request, it means that the event data has passed from your website, through your server container, and on to the final destination.
Additional tools useful for debugging
Beyond the debugger, several additional tools support debugging an sGTM setup – covering everything from request-level detail to overall site tracking health. Which one to use depends on the data source and what you're trying to verify.
- Stape GTM Helper – a free Chrome extension that makes GTM's preview mode easier to use, with no sign-up or paid plan required. It color-codes tags by platform so you can instantly spot which ones failed, cleans up messy JSON and URL data into readable tables, and shows whether a visitor gave tracking consent – all directly inside the preview screen.
- Stape logs – a feature that keeps a record of the requests your server container sends and receives, so you can review what data was sent and what came back. Click into any logged request to see its full details when something needs troubleshooting.
- Logger tag – a tag for server-side GTM that logs requests to your server container, including POST request bodies (not captured by default logs), helping you track down issues. It sends logs to Console, Data Store, BigQuery, or elsewhere.
- sGTM Preview Header – a power-up that lets you see requests in the sGTM debugger even when they don't come from your web GTM container, like webhooks, APIs, or CRM events. Pair it with a Data Client to debug webhooks specifically.
- Monitoring – a feature that checks your server container's logs and sends you an email if something goes wrong – like a sudden drop in events, a spike in errors, or missing requests – so you can catch problems early.
- Website Tracking Checker – a free tool that scans your site to assess tracking health across analytics, advertising, cookies, and SEO. Provides a score along with actionable recommendations to improve data accuracy and overall tracking performance.
Was this article helpful?
🍽 Table of content:
Comments