Subscription and usage statistic of sGTM
Updated Nov 10, 2026
Usage statistics provide a real-time snapshot of your request consumption, showing exactly how many requests or events your container or Signals Gateway has processed in the current billing cycle and how close you are to reaching your plan's limit.
To check your current usage, simply open your container or Signals Gateway inside your Stape account. You'll find these insights located in two spots:
- Right below the product name, the progress bar displays your current usage, plan limit, percentage used, and the days remaining until renewal. It also features a smart usage forecast that tells you ahead of time if the product will go over the limit soon, so you can upgrade before it gets paused.
- The Subscription tab includes the Usage Statistic section, complete with a detailed breakdown categorized by client type.
Containers measure activity in requests, whereas Signals Gateway tracks events. Both counters reset automatically at the start of every billing cycle.
Usage forecast
The usage forecast shows whether your container or Signals Gateway will reach or go over its request/event limit before the billing cycle ends. It estimates your total usage by the renewal date from recent traffic, then compares that estimate with your plan limit.
The forecast is on by default for every container and Signals Gateway.
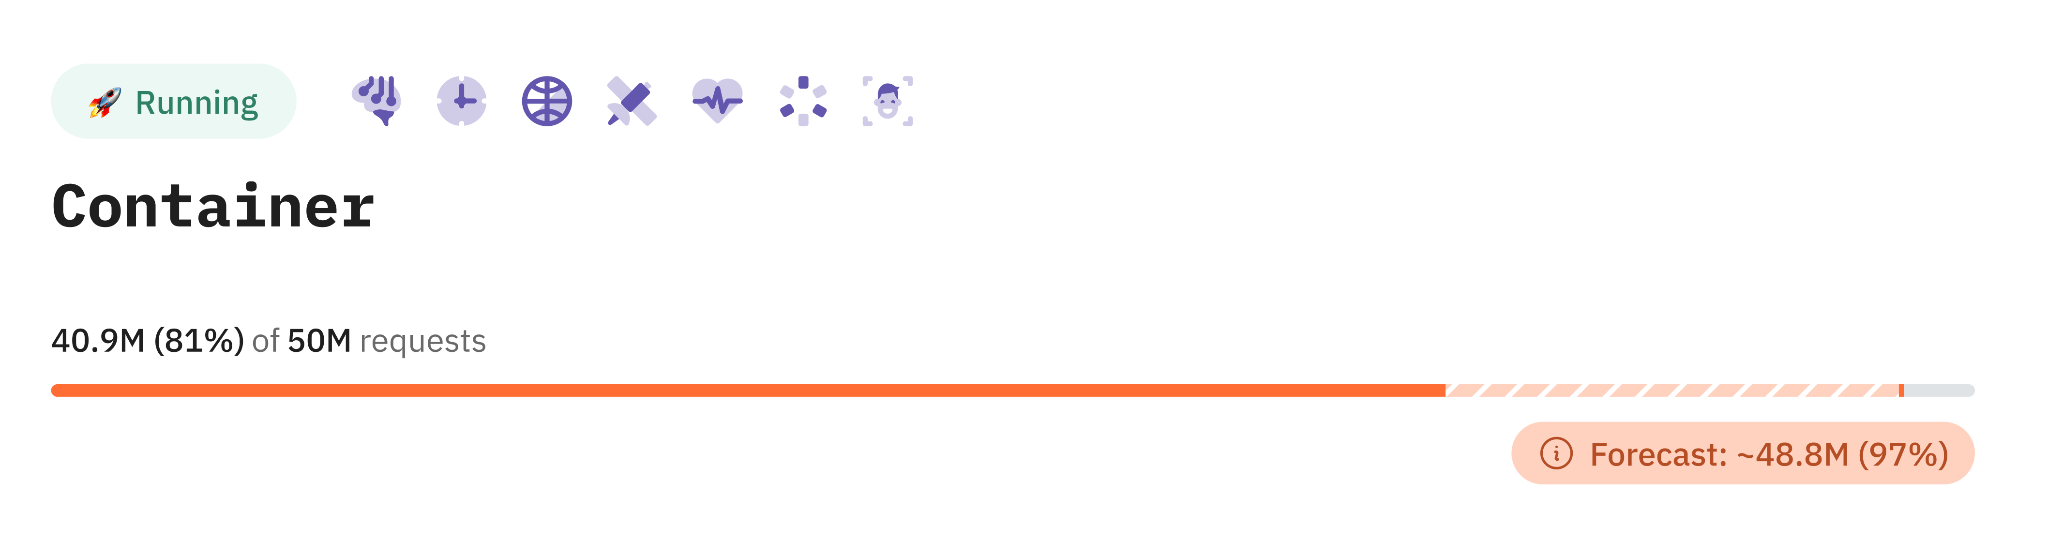
The forecast badge under the progress bar shows your estimated total by the renewal date, and that total as a percentage of the plan limit. The badge appears only when the estimate gets close to the limit, and the progress bar turns orange as well.
When you reach full capacity, the progress bar and badge turn red.
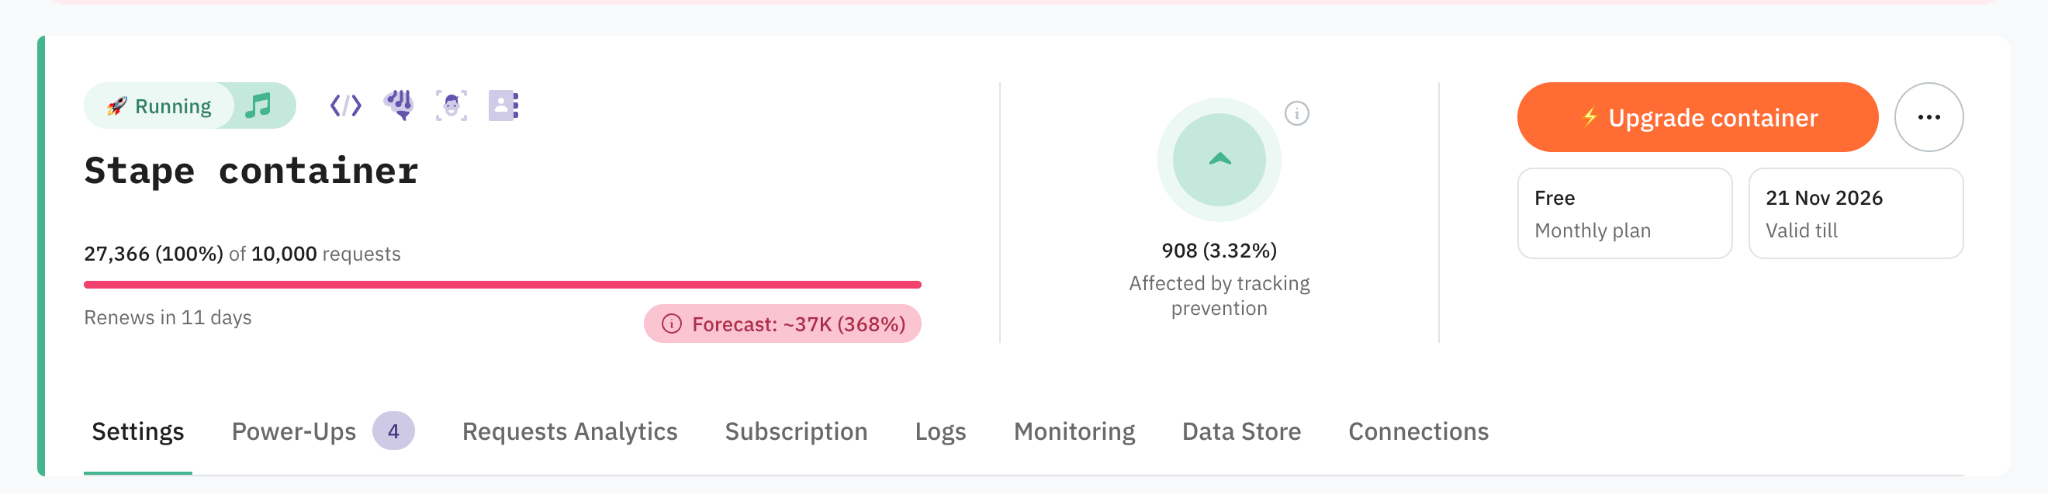
Hover the badge to see how the estimate was built. You’ll see your daily average for the active billing period (for example, "your current average of 219 requests/day"). Because the forecast relies on a weighted rate, the final projected total might differ slightly from simply multiplying this daily average by your remaining days.
Here’s how the forecast formula works – it blends activity across three periods:
- Current billing cycle – 60% of weight
- Previous month – 30% of weight
- The month before that – 10% of weight
Any periods without traffic are automatically excluded from the calculation.
To generate an accurate prediction, the forecast requires a minimum of 7 days of recorded traffic.
Here’s a breakdown of how the progress bar is split:
- Current usage – the total number of requests or events already processed during the active billing cycle.
- Forecasted usage – the volume anticipated by your upcoming renewal date.
- Remaining capacity – the portion of your plan limit expected to stay available at renewal date.
If the forecast indicates that a container or Signals Gateway will reach 100% of its request or event limit before the renewal date, Stape will automatically send an email notification.
To learn more about what occurs when your usage exceeds the limit, read Request limits and pause logic.
Usage statistics by client type
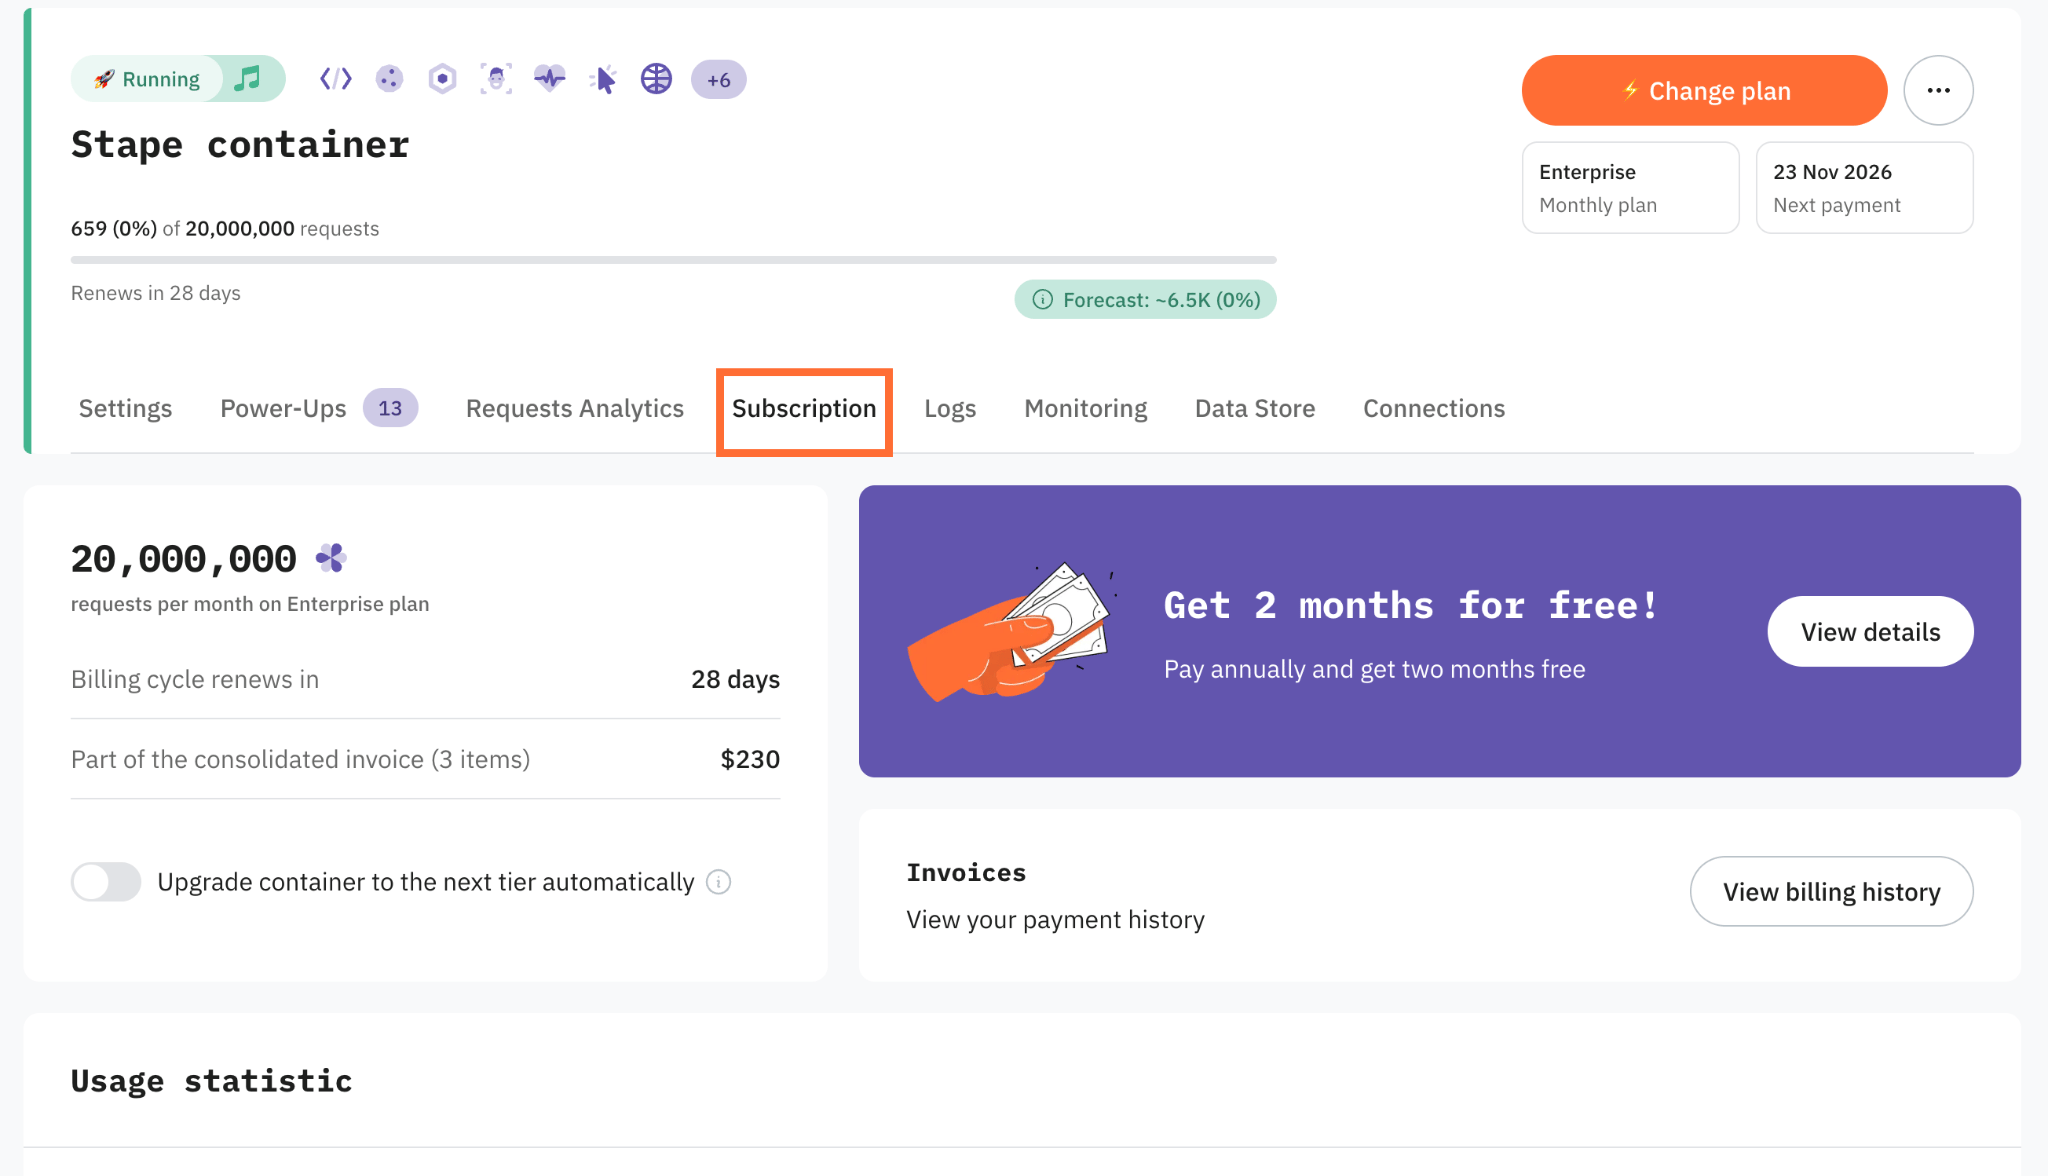
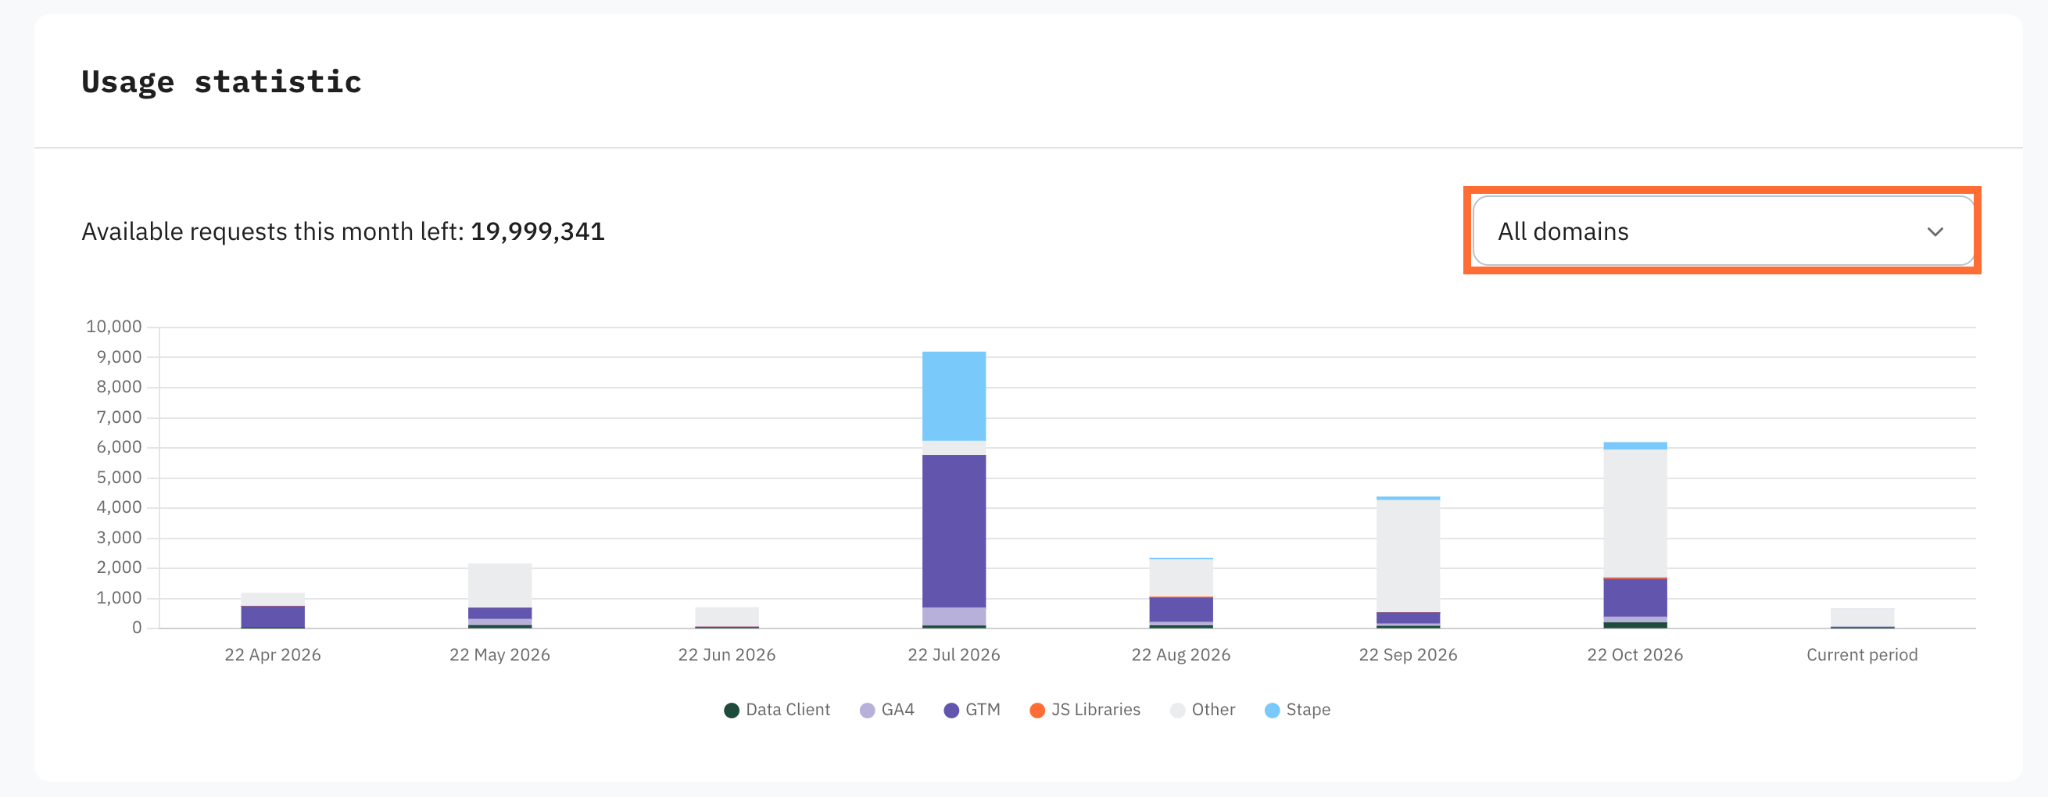
You can check the usage statistics of your server GTM container by client type in the Stape admin account. To do it, log in to the Stape account → choose a container → click the Subscription tab → scroll down to the Usage Statistic section.
- Data Client – shows the requests sent from the Google Tag Manager web container to the server container (if you are using Data Tag/Data Client).
- GA4 – all the requests that are associated with Google Analytics 4.
- GTM – shows requests if you are running the Google Tag Manager preview. When the preview is running, once every 10 seconds (and maybe more often), it will keep on sending those hits to your server container.
- JS Libraries – if you are using a custom domain and Custom Loader, all the scripts such as
gtm.jsandgtag.jsare loaded from your custom domain and counted as a hit to your server container. - Stape – requests to the Data Store if you are using it.
- Other – any request to your server container that doesn’t refer to the clients described above.
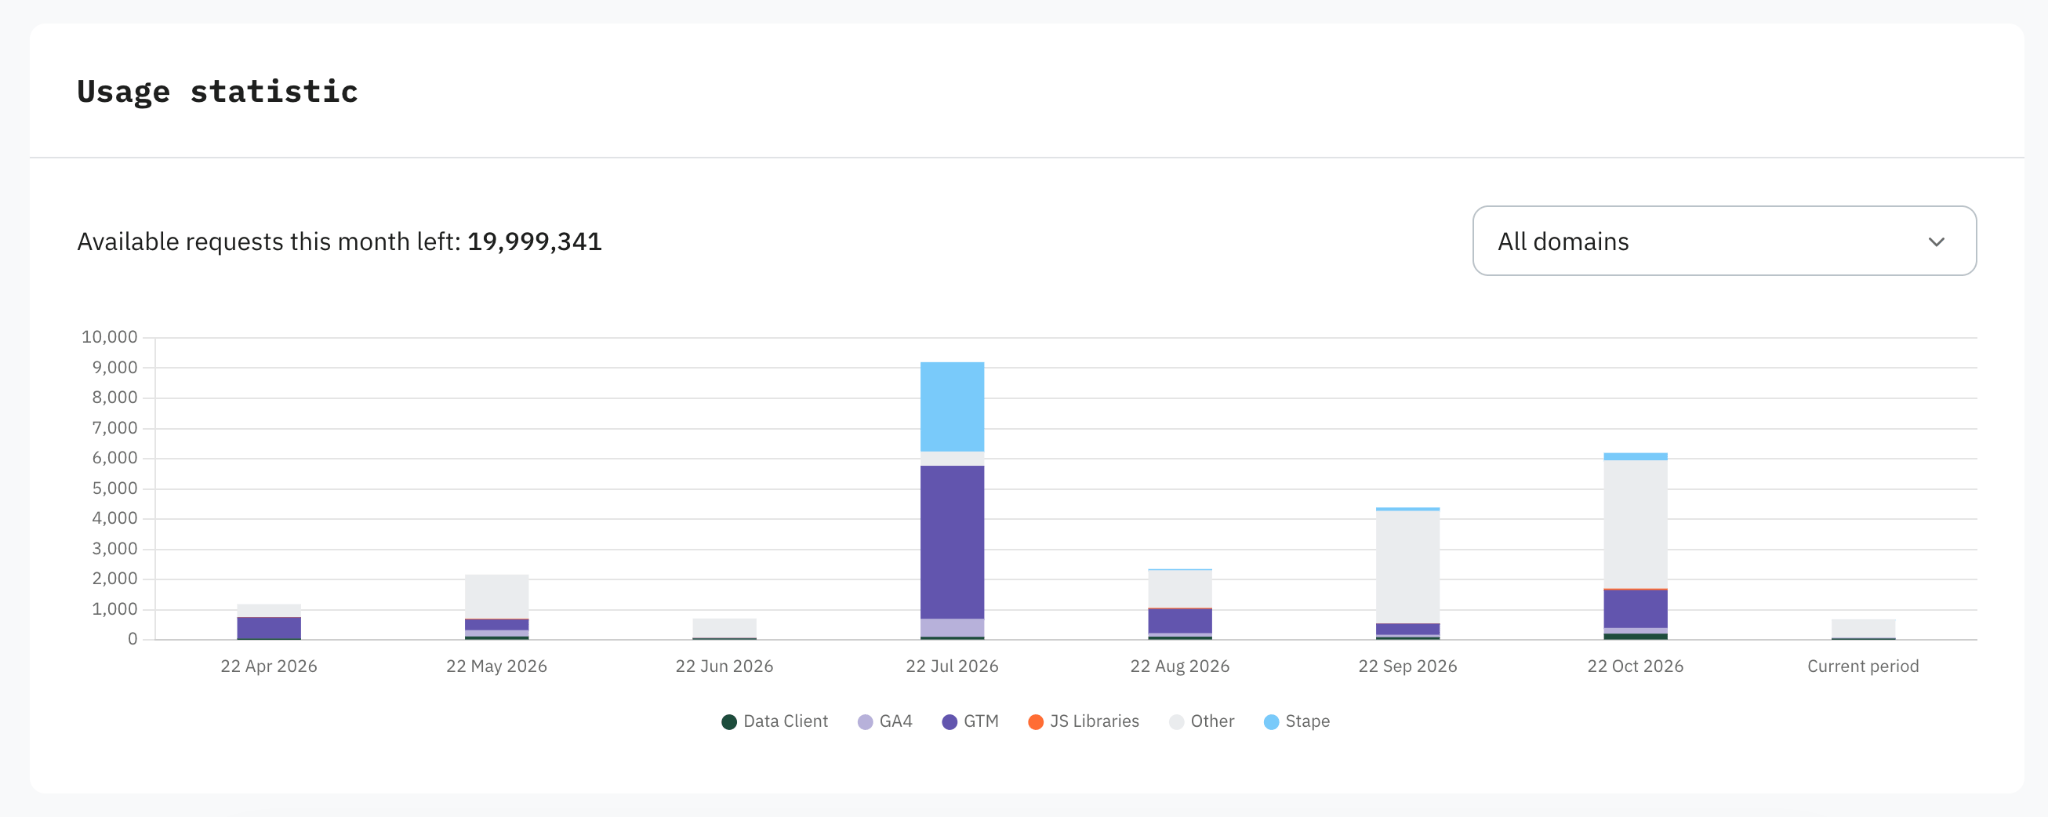
Please note, if you are using the Multi-Domain power-up, you can also see the statistics by specific domain.
Was this article helpful?
🍽 Table of content:
Comments