How to debug sGTM configuration using Preview Mode
Updated Mar 10, 2026
This guide explains how to check:
- Web GTM Preview:
- Web event exists: event data from a user’s browser reached your web GTM container.
- Web tag sent: web container passed event data to your server GTM container.
- Server GTM Preview:
- Server received the request: event data reached the server GTM container.
- Client processed the request: the server container correctly interpreted event data.
- Server tag sent: the server container passed the outgoing request to the final platform (GA4, Meta, etc.)
Before you start
1. Install Google Tag Assistant
Google Tag Assistant is Google’s official tool that ensures smooth functioning and accuracy of tags in Google Tag Manager.
How to use Google Tag Assistant:
- Install the Google Tag Assistant extension for Chrome.
- Launch the Preview mode in Google Tag Manager.
- Once you connect to your website with preview, Tag Assistant will launch automatically.
2. Install Stape GTM Helper
If your GTM containers include multiple tags, triggers, and variables, it may be a good idea to use the GTM Helper extension. This is a free Chrome browser extension developed by Stape that makes debugging web and server-side GTM containers easy and intuitive.
How to use GTM Helper:
- Install the Stape GTM Helper Chrome extension for Chrome.
- To configure the extension, open your GTM container and click on the extension’s icon.
- Launch the Preview mode in Google Tag Manager. You will notice new or updated features, such as the entity filter or tag type coloring. For more information about the extension and its features, check out our detailed guide on GTM Helper.
How to use Preview to debug your sGTM setup
1. Open preview mode in web and server containers
- Open your server GTM container → click Preview.
- In a different browser tab, open your web GTM container → click Preview → enter your website’s URL.
This will start the web debug session. Your website will open in a new window with the GTM debug panel active at the bottom.

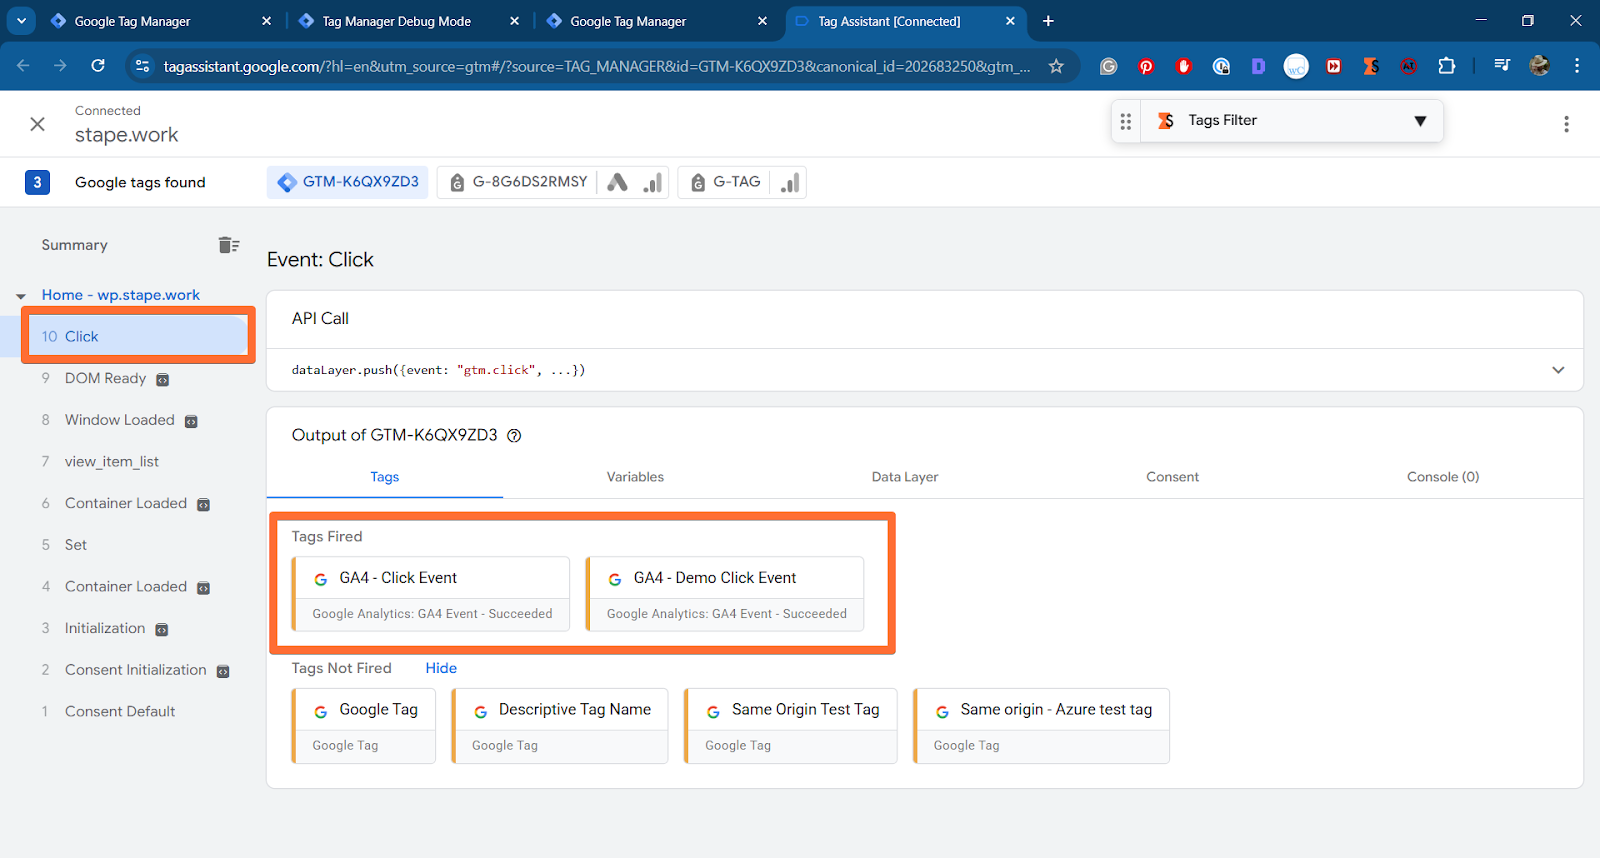
2. Trigger a request from your website
- Perform actions that trigger tags. By simply loading the page, you’ve triggered the page_view event. Other simple possible actions include reloading the page or clicking a button. Such events will show in your debugger.
- In the web GTM Preview, click on the event. Under Tags Fired, find the tag you configured to send data to your server (e.g., Google Analytics 4 tag). If it fired, it means the tag worked. Next, select the tag and inspect the hit sent - check that it was sent to your server container URL.
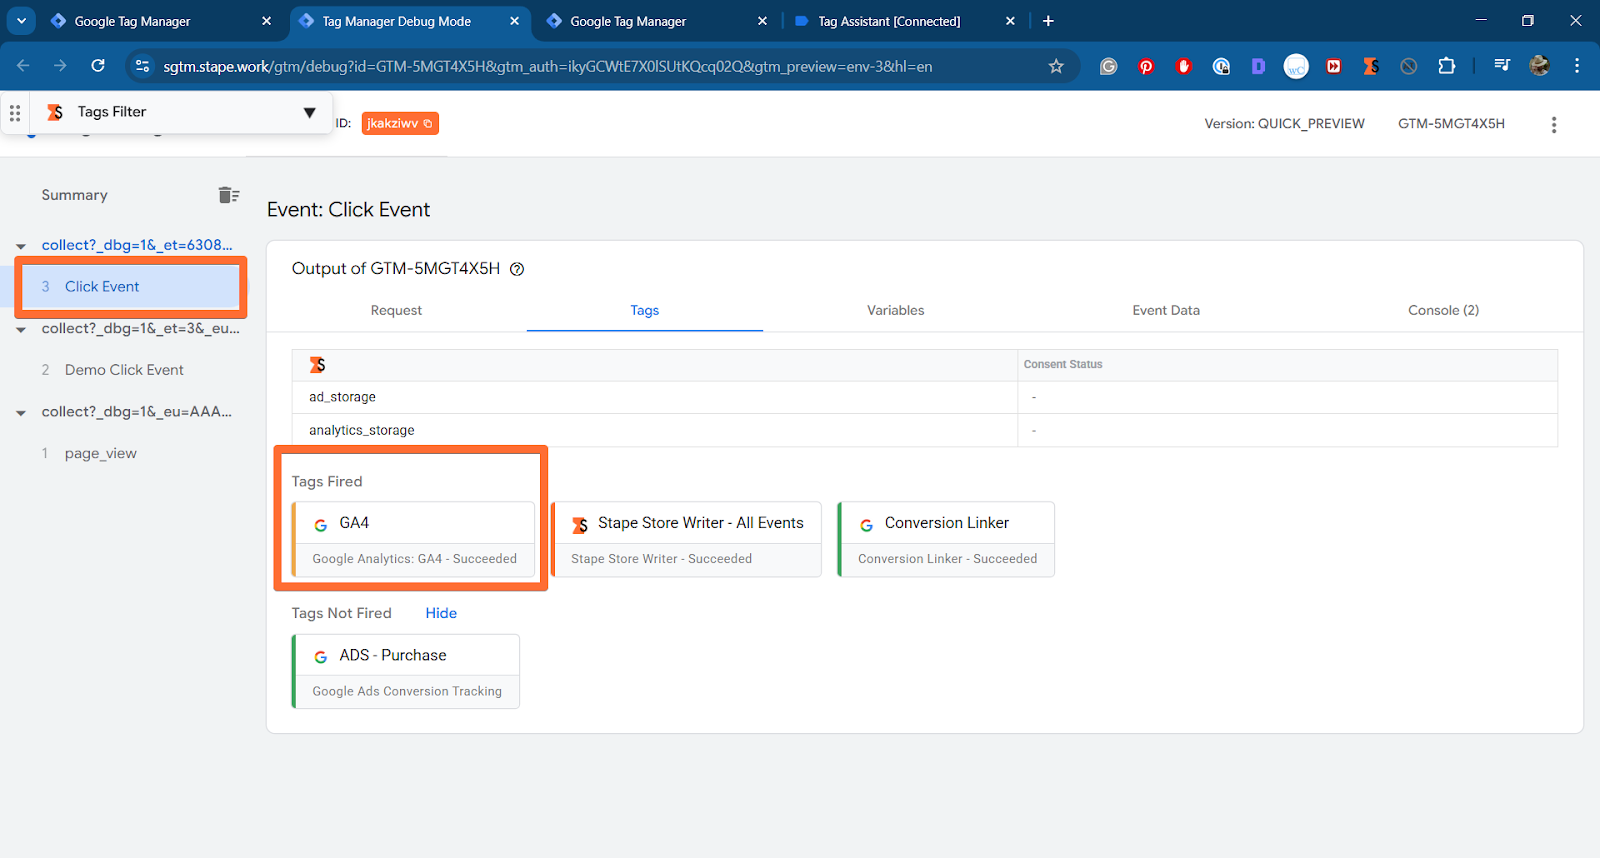
3. Check incoming requests in the server GTM Preview
- Go back to the server GTM Preview tab you opened in the first step.
- If you see events coming from your website domain, the setup works and requests are successfully reaching your sGTM container hosted on Stape.
- Click on the incoming request. Check the Tags Fired tab to see that your server-side tags (like the GA4 tag) have activated.
- In the fired tag, check the Outgoing HTTP Requests tab to see the request that your server container successfully sent to Google Analytics.
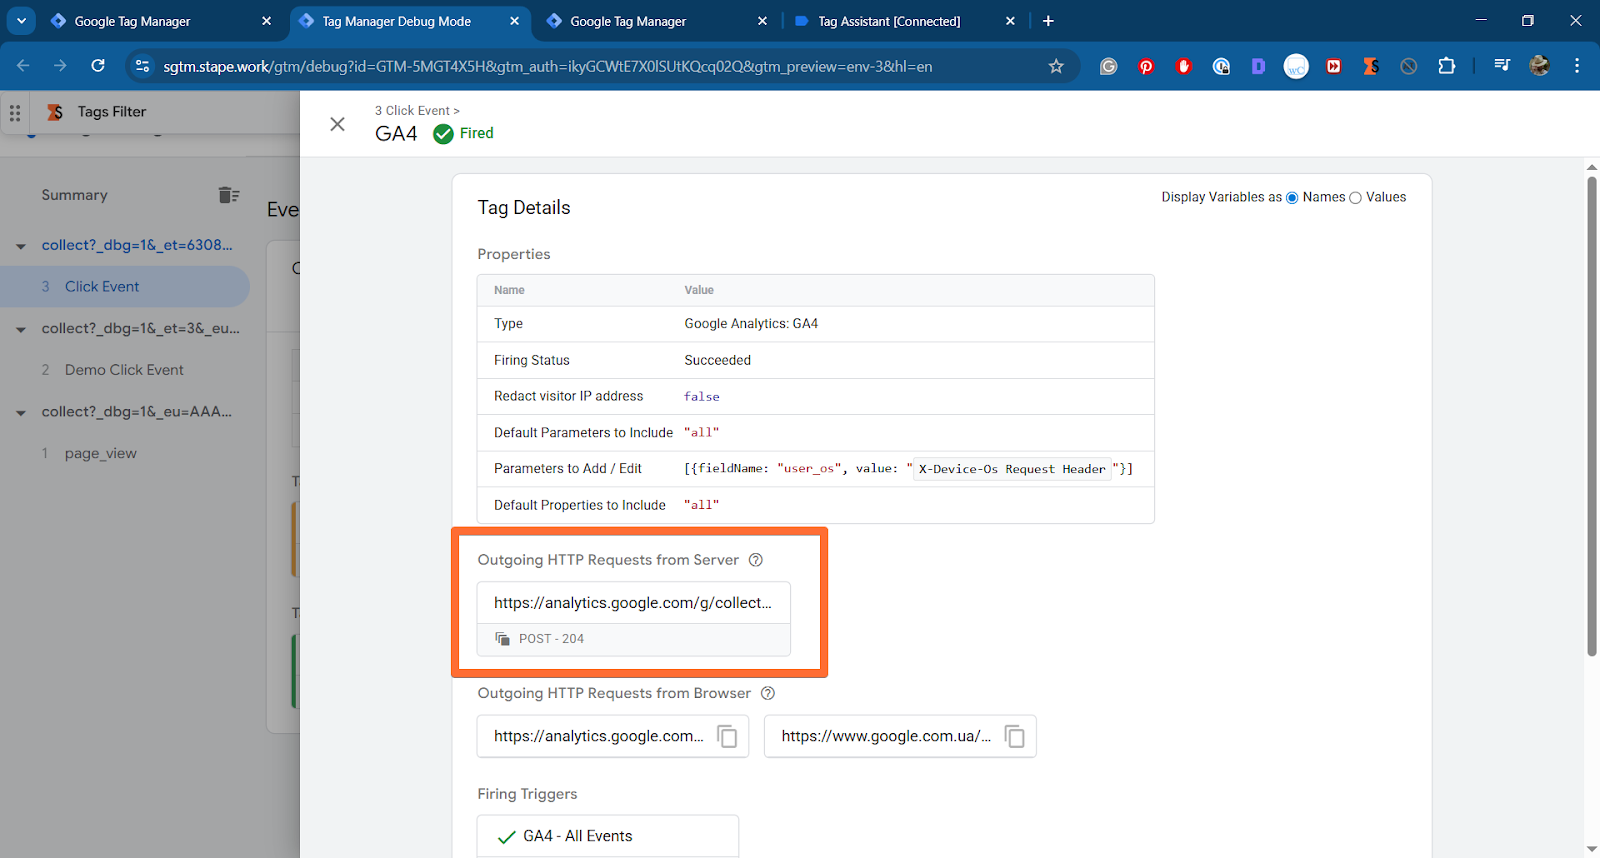
If you see that outgoing request, it means that the event data has passed from your website, through your server container, and on to the final destination.
Common web preview problems
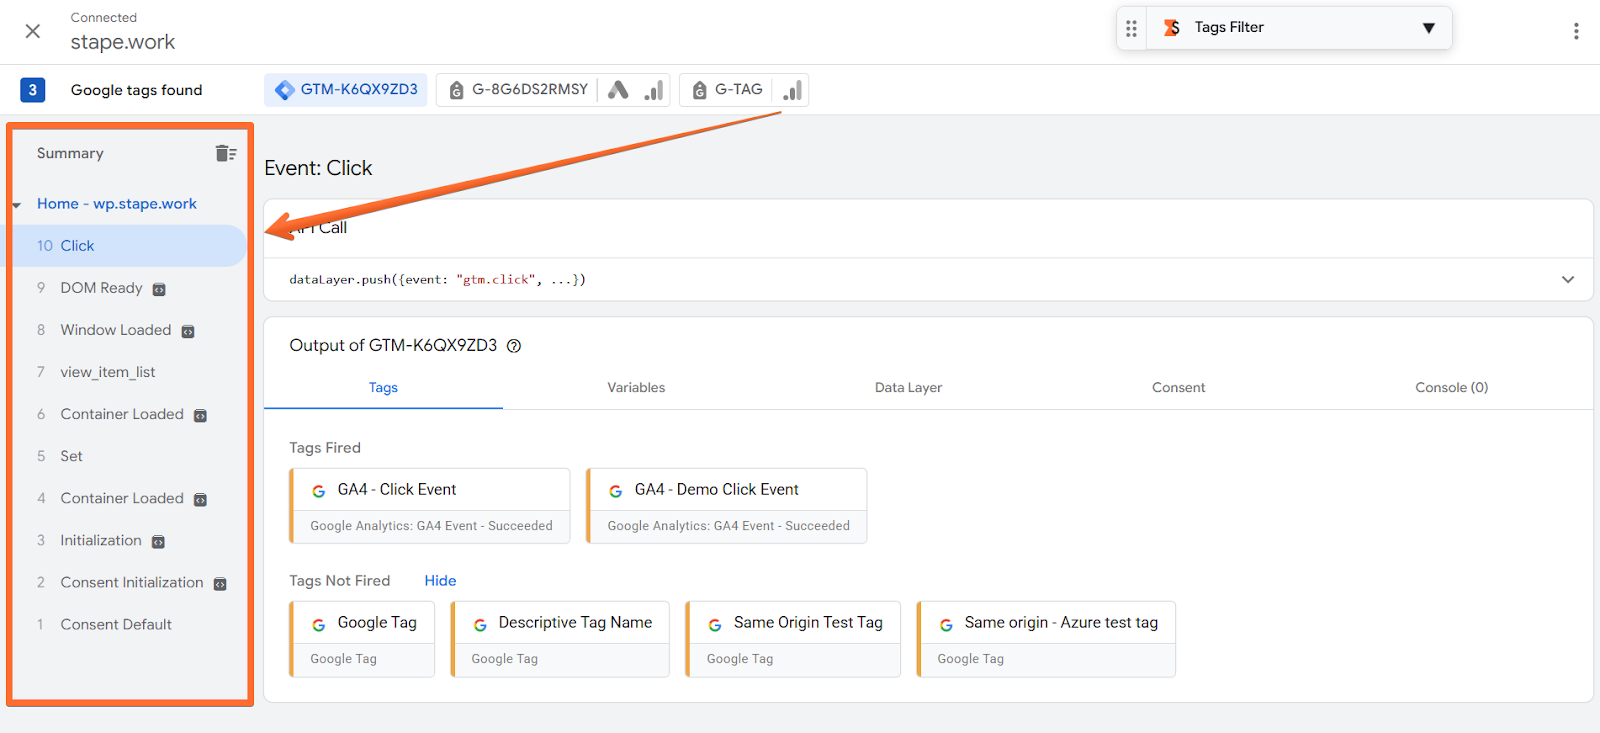
Summary (event timeline)
The chronological sequence of events detected on the page.
Common problems:
- Expected event is missing.
- Duplicate events are fired.
Possible solutions:
- Check the event’s configuration and trigger in the web GTM container.
- Check for duplicate scripts or triggers on the page.
Tags tab
Tags that fired or did not fire for the selected event.
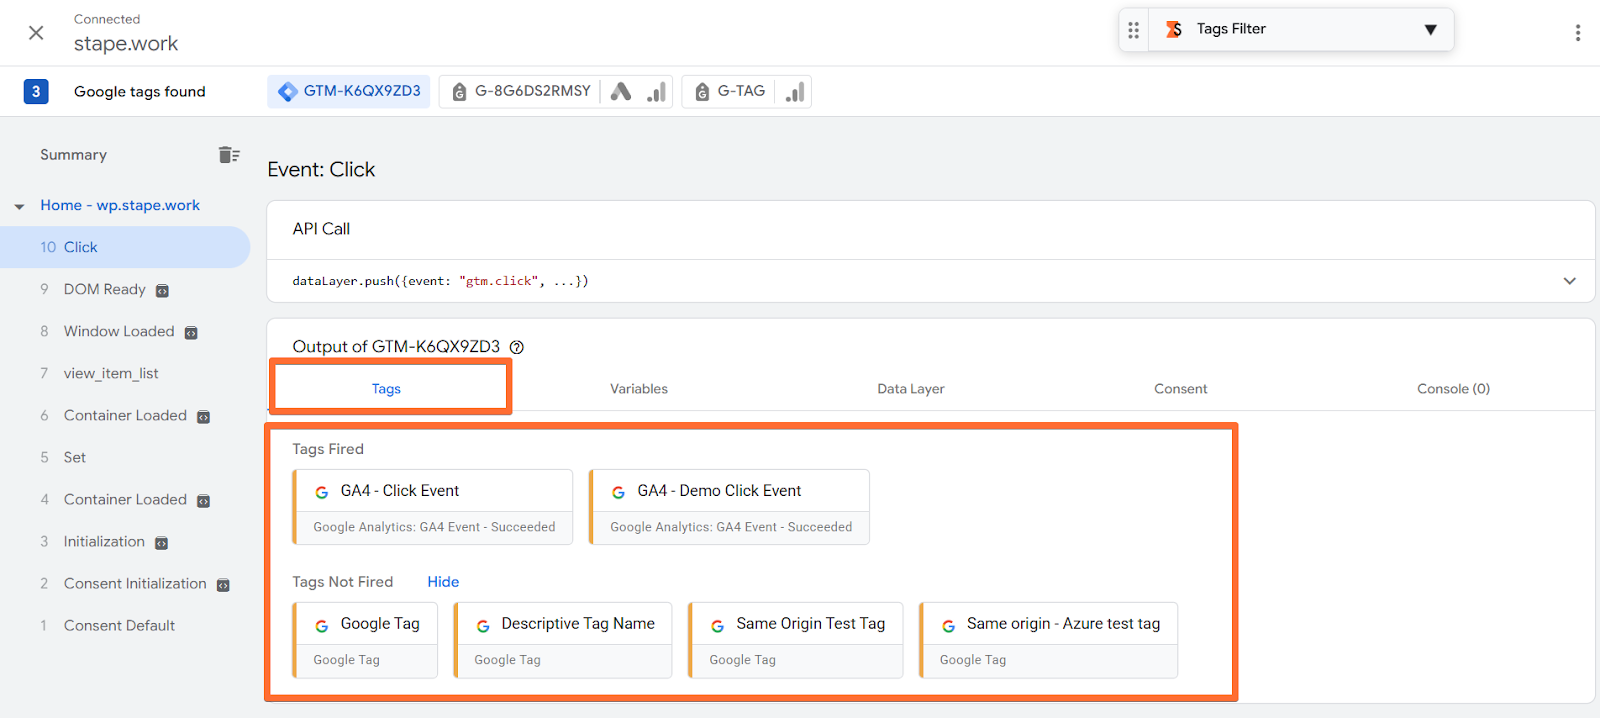
Common problems:
- Tags not fired.
Possible solutions:
- Trigger conditions are wrong - check the tag’s configurations.
- Consent blocked it - check the Consent tab to see more details on which permissions are missing.
- Variables are missing (for some platforms) - click on the tag and check the section Firing Triggers to learn which. Then check its variables. It will help you find the variables and their values to set up the tag’s trigger correctly.
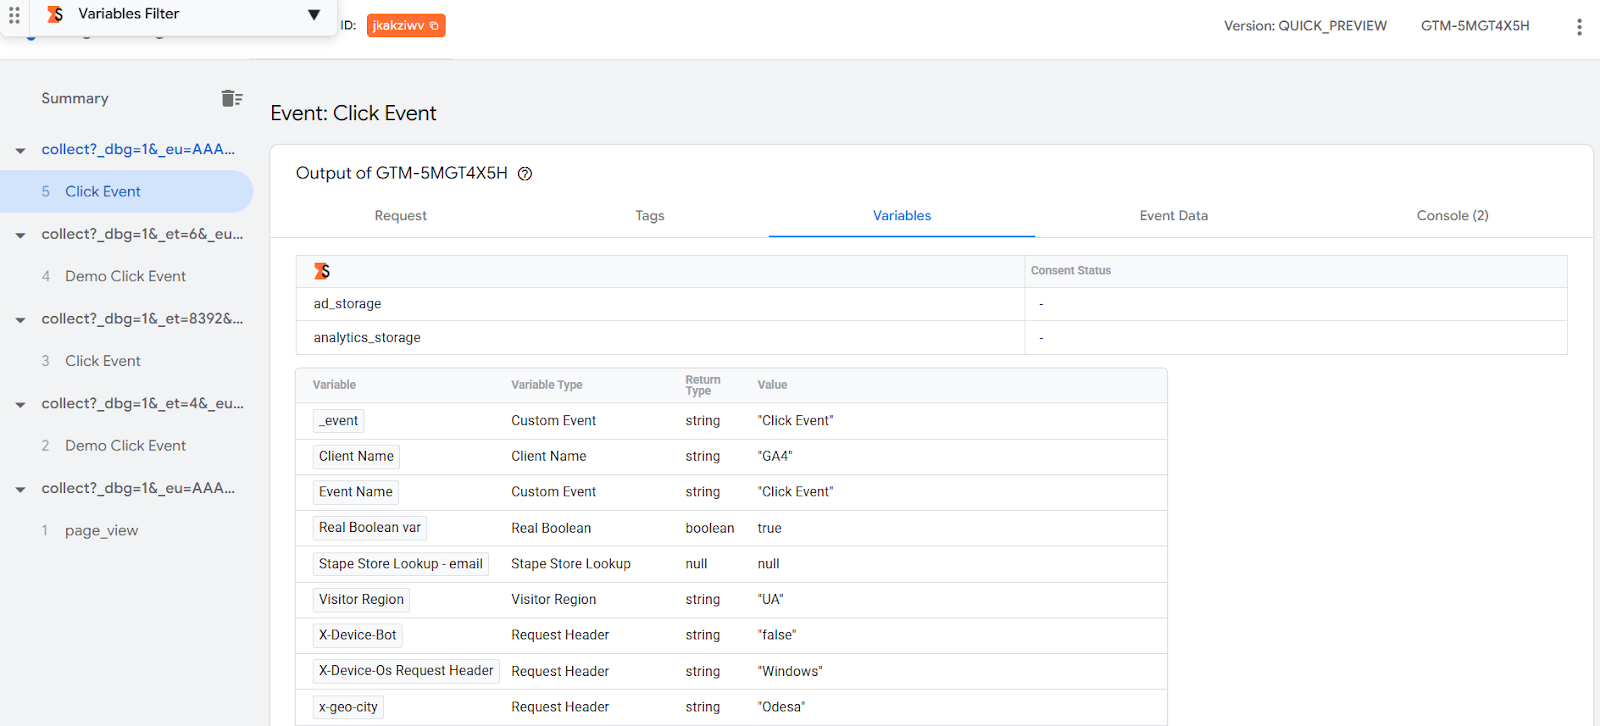
Variables tab
Shows what values your variables captured. Pro tip: while the following advice for this tab is correct, it’s best to inspect the variable values of specific tags (in the Tags tab), instead of all variables shown here. The Variables tab shows all of the variables of the container, not all of which will be relevant for each tag.
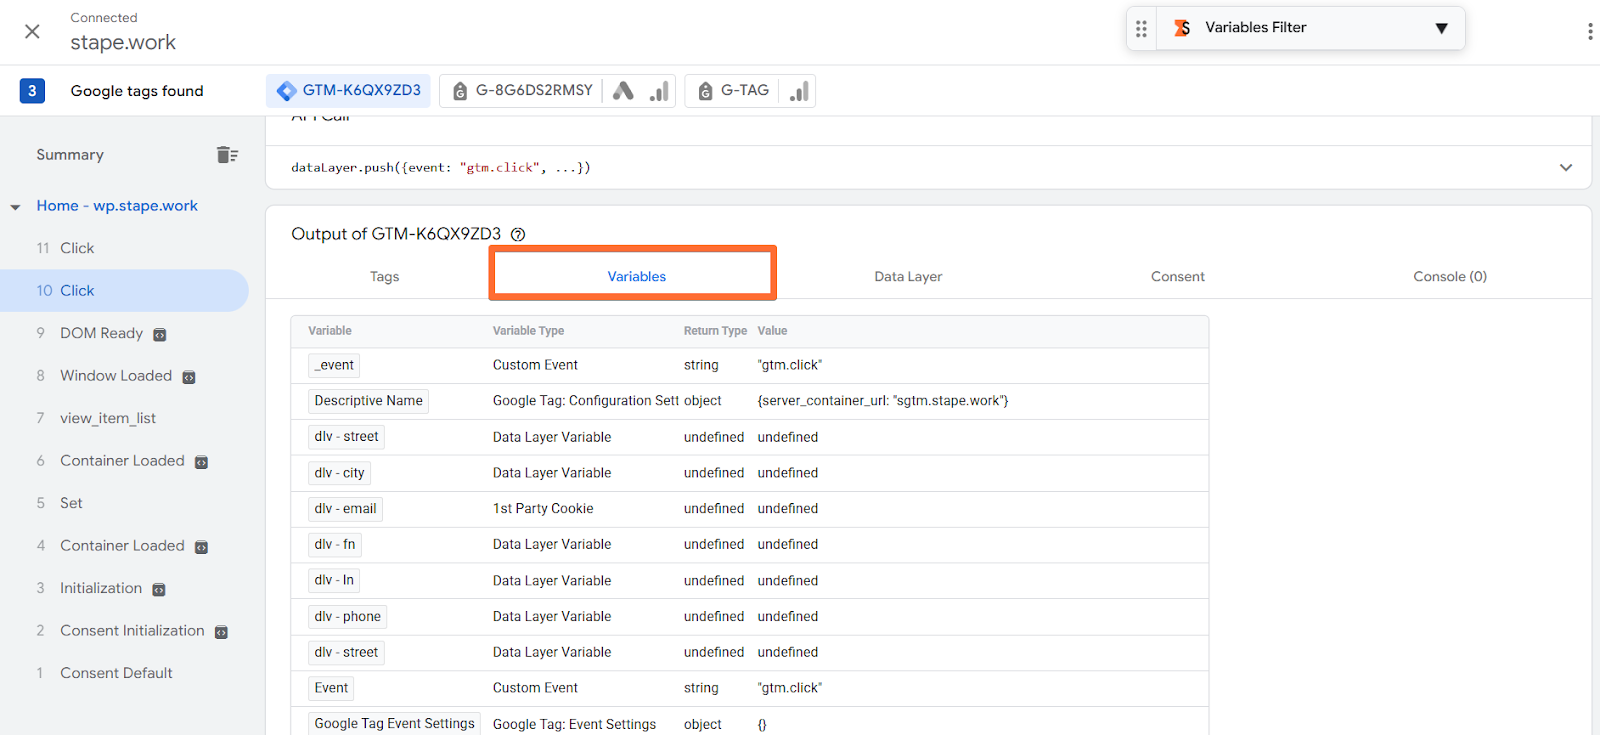
Common problems:
- Undefined or wrong value. Keep in mind, this doesn’t always mean there is an issue. For example, an email value will surely be undefined for the steps where the user hasn’t provided it yet, for instance, at the page_view event. So consider what type of event you’re inspecting while deciding whether the lack of value in its variables is an error or not.
Possible solutions:
- Fix the variable’s setup in GTM.
- Check that the data appears in the Data Layer tab and that its key matches the variable's name.
Data Layer tab
Shows raw data sent by the website.
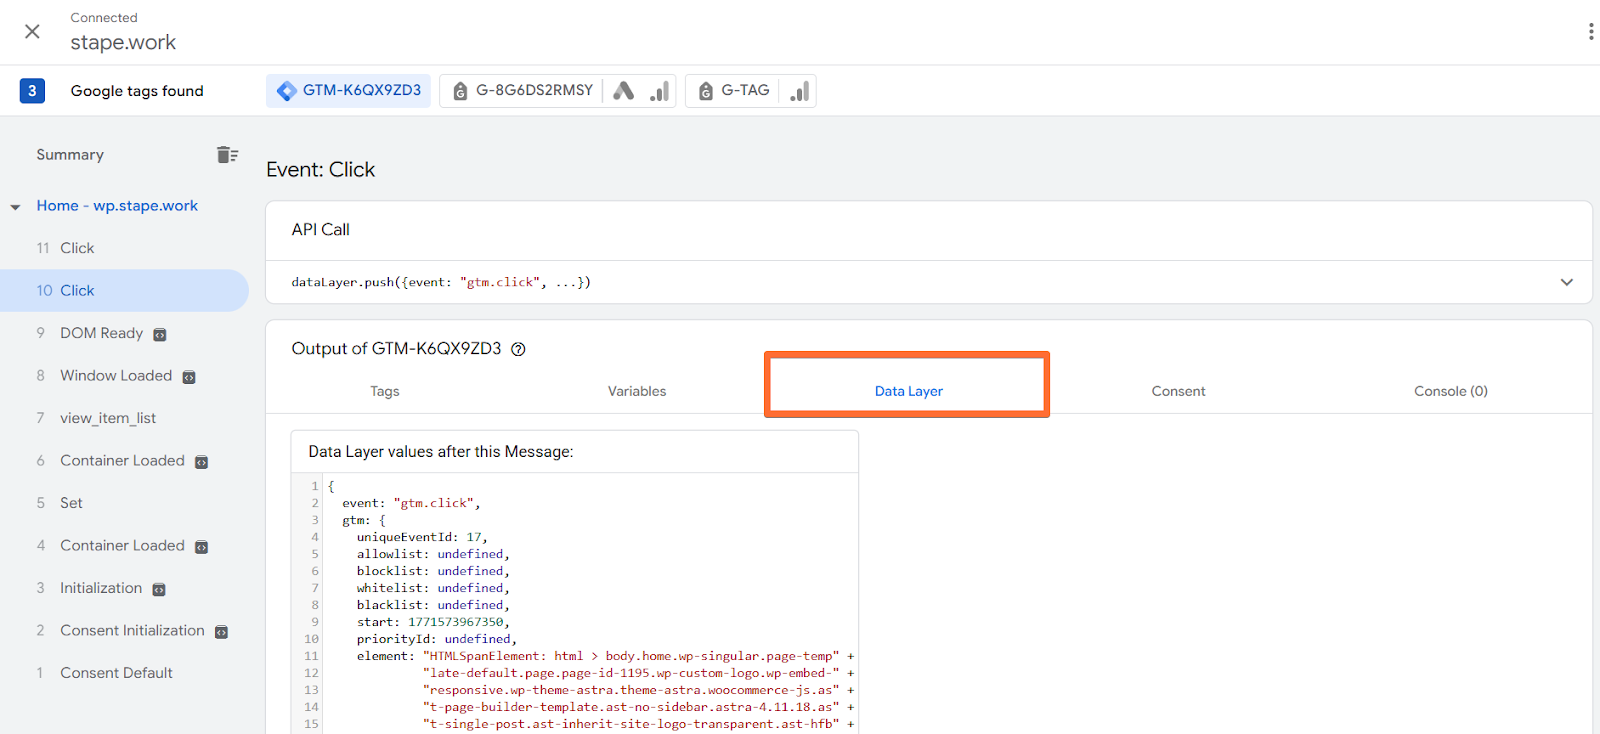
Common problems:
- Data is missing or wrong.
Possible solutions:
- Tags don’t fire - if you can't fire tags in all needed locations on the website, check the variable names on different pages.
- Data layer push doesn’t work - if you see that variables or events fail to push, you most likely don’t use proper casing for object names or missed quotes.
Troubleshooting data layer
Problem 1: Data layer push doesn’t work
If you see that variables or events fail to push, you most likely don’t use proper casing for object names or missed quotes.
Solution: proper casing for object names and quotes
- Check whether "dataLayer" is in the camel case.
Good example:
dataLayer.push({'variable_name': 'variable_value'});
Bad example:
datalayer.push({'variable_name': 'variable_value'});
- Make sure all the variable names are enclosed in quotes.
Good example:
dataLayer.push({'variable_name': 'variable_value'});
Bad example:
dataLayer.push({variable_name': 'variable_value'});
Problem 2: Tags don’t fire
Problem 2: Tags don’t fire
If you can't fire tags in all needed locations on the website, check the variable names on different pages.
Solution: consistent variable names
The most frequent mistake is inconsistent casing in the variable names on different pages, so you need to review the names.
Good example:
// Homepage:
dataLayer.push({'variable_name': 'variable_value'});
// Product page:
dataLayer.push({'variable_name': 'variable_value'});
Bad example:
// Homepage:
dataLayer.push({'variable_name': 'variable_value'});
// Product page:
dataLayer.push({'variable Name': 'variable_value'});
Consent tab
Shows the state of consent for every type of relevant tracking action.
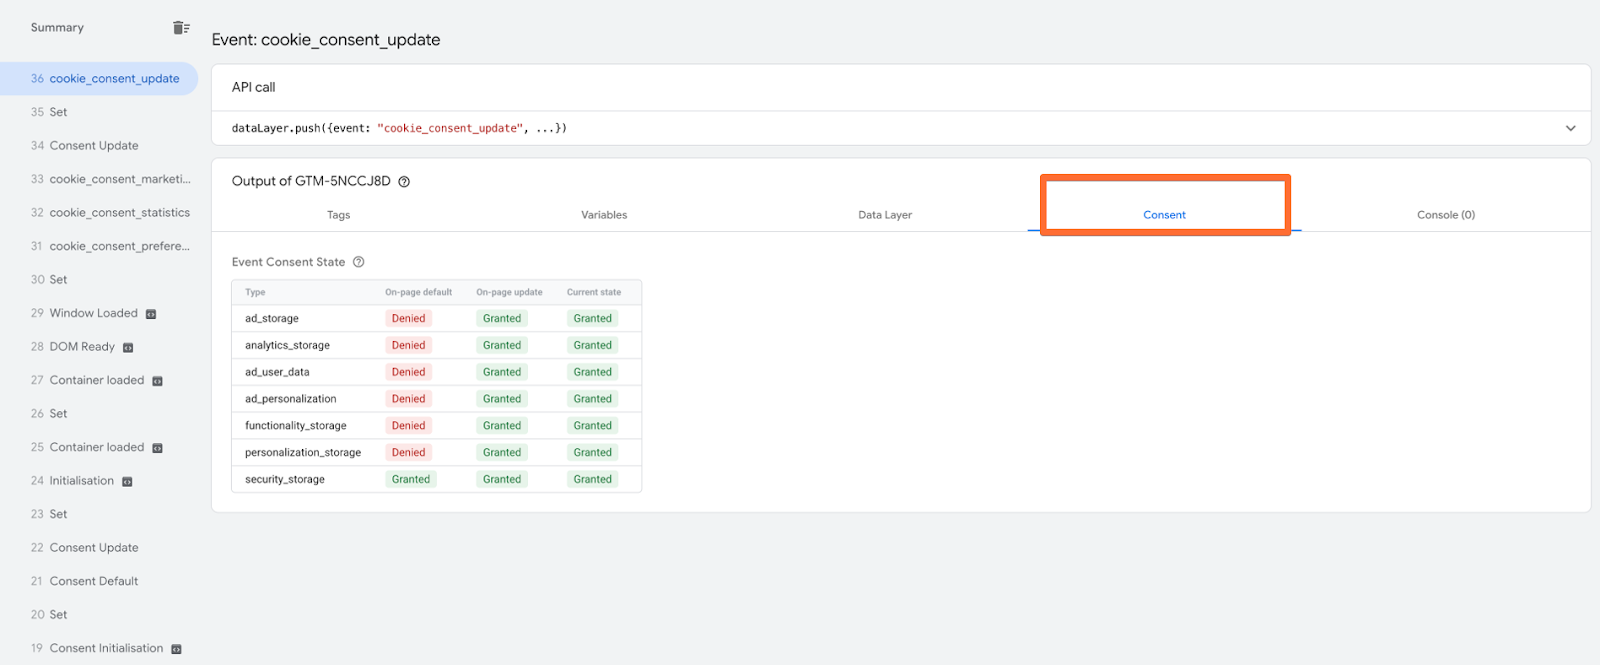
Common problems:
- Consent not provided.
Possible solutions:
- Learn more in our guide on consent in sGTM tracking.
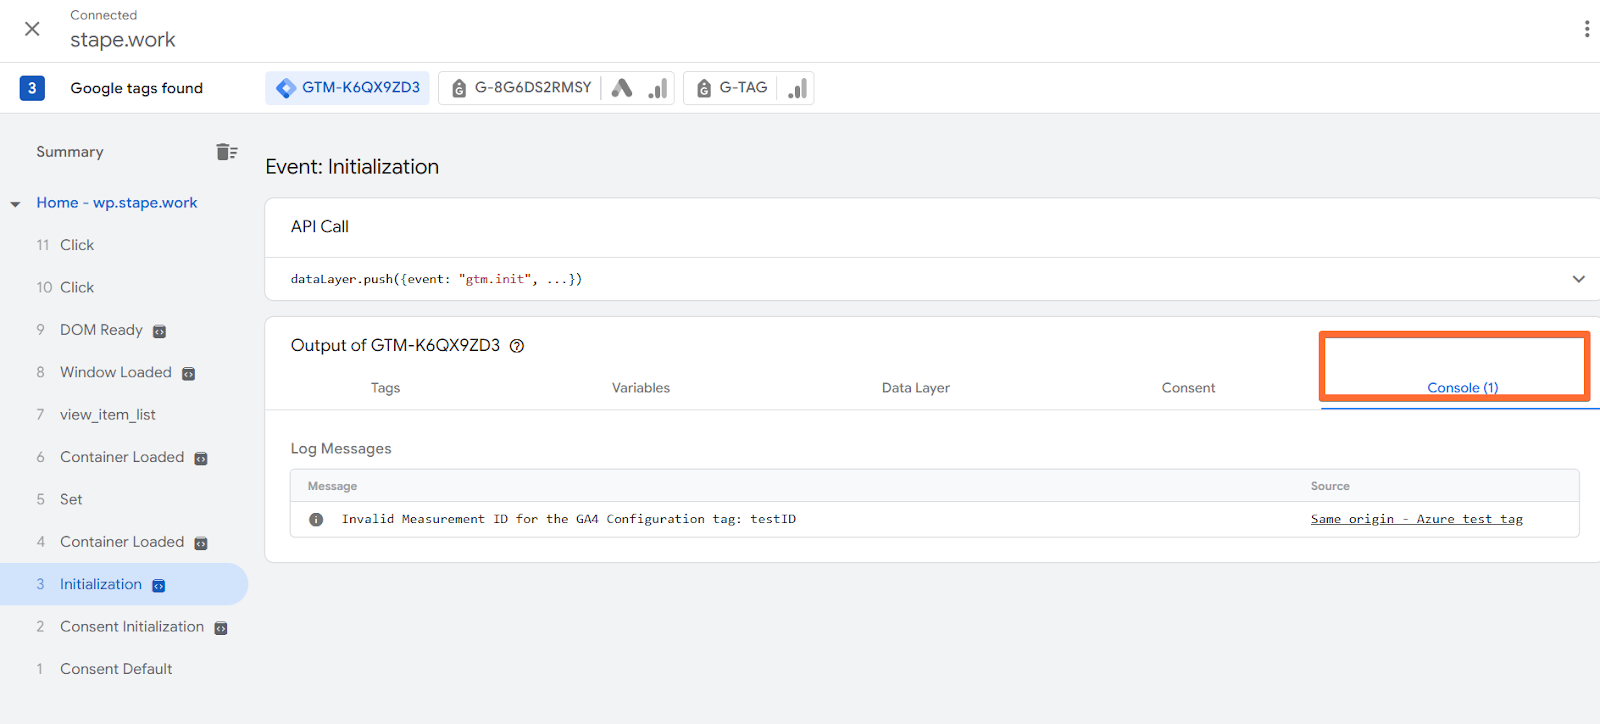
Console tab
This screen will show you information about any errors that occurred on the side of web GTM, which is extremely useful for debugging.
Common server preview problems
Summary (event timeline)
Similar to web preview, this section shows all requests that reached your server GTM container.
Common problems:
- Expected event is missing.
Possible solutions:
- Check the event’s configuration and trigger in the server GTM container. If the server preview doesn’t show the event that’s been successfully sent from the web container, it means the request never reached the server.
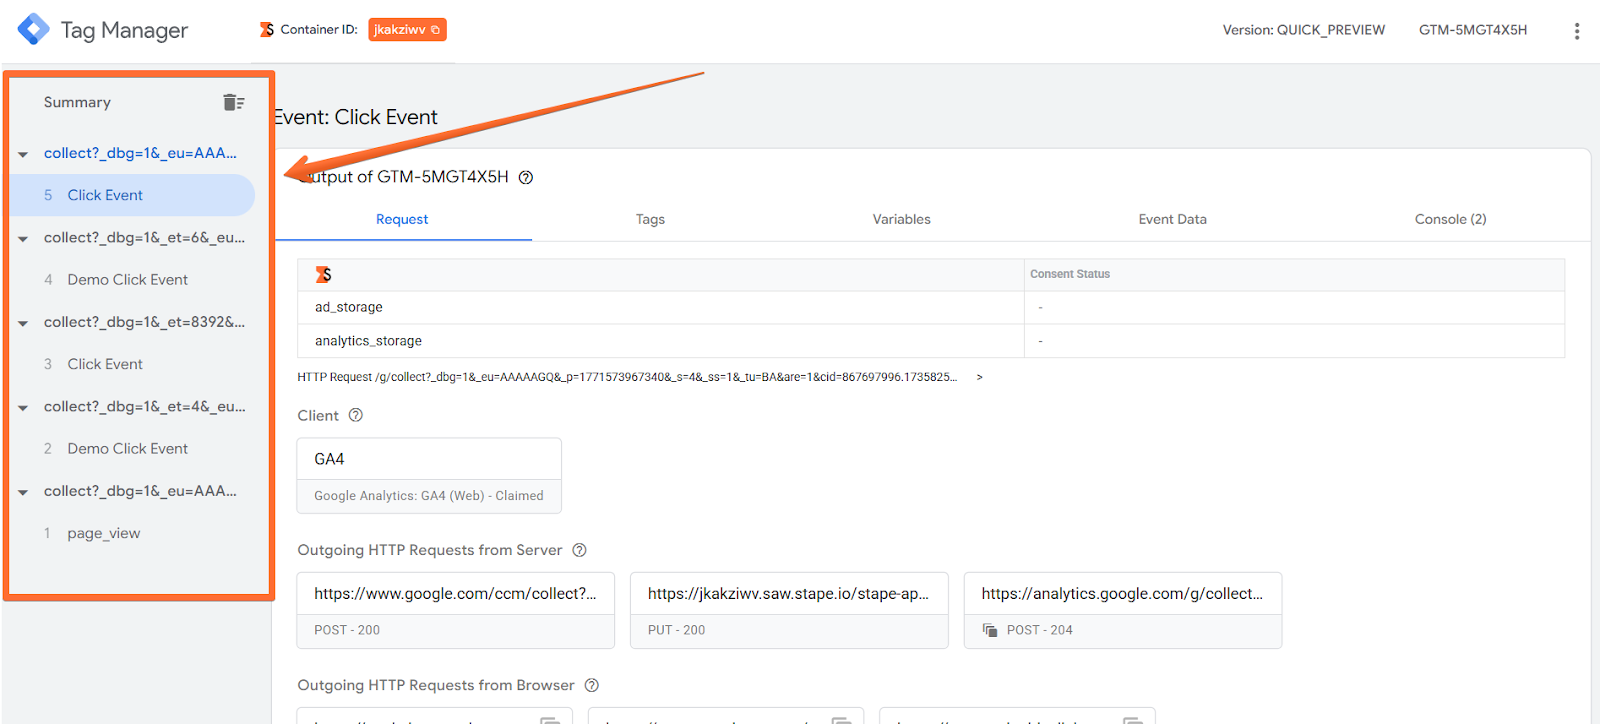
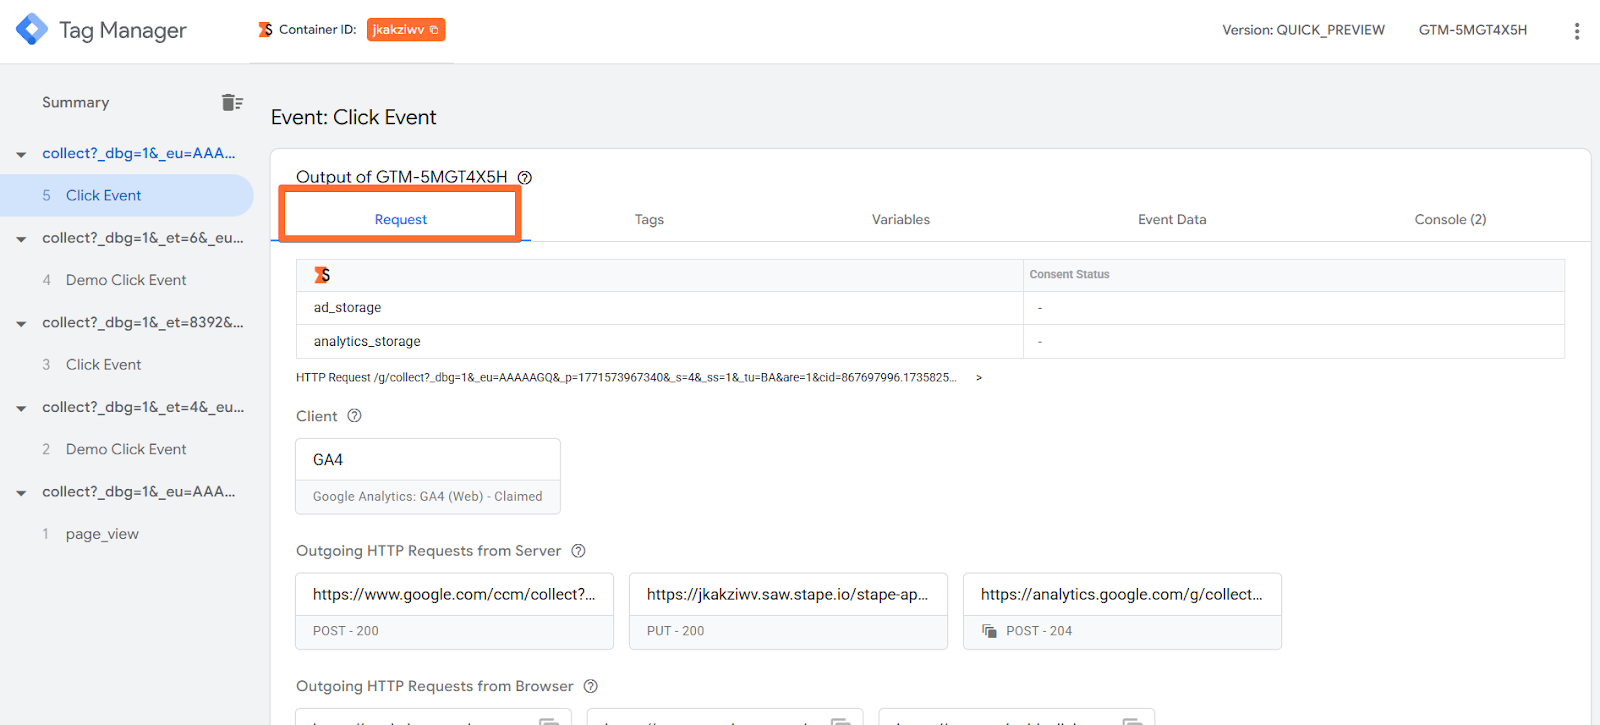
Request tab
This tab shows a lot of information about your request.
Common problems:
- No client claimed the request.
- Missing request headers.
- Outgoing request returns non-20X status.
- Request path mismatch.
Possible solutions:
- Client - if no client claimed the request, check the Request URL in the Incoming HTTP Request menu - there may be a request path mismatch or typos in the URL.
- Incoming HTTP Request - the Request Headers section is useful to verify that the server GTM container correctly enriches requests with necessary data (for instance, the user’s geo data). If some headers are missing, check the tag’s settings on the server container. A good idea is to activate Stape’s Custom Loader power-up, as it automatically adds a number of geo parameters to the event data.
- Outgoing HTTP Request - if the response code for the outgoing request is different from 20X, it means there were some issues with processing the request. You can check the response body and read which error exactly stopped the request from processing.
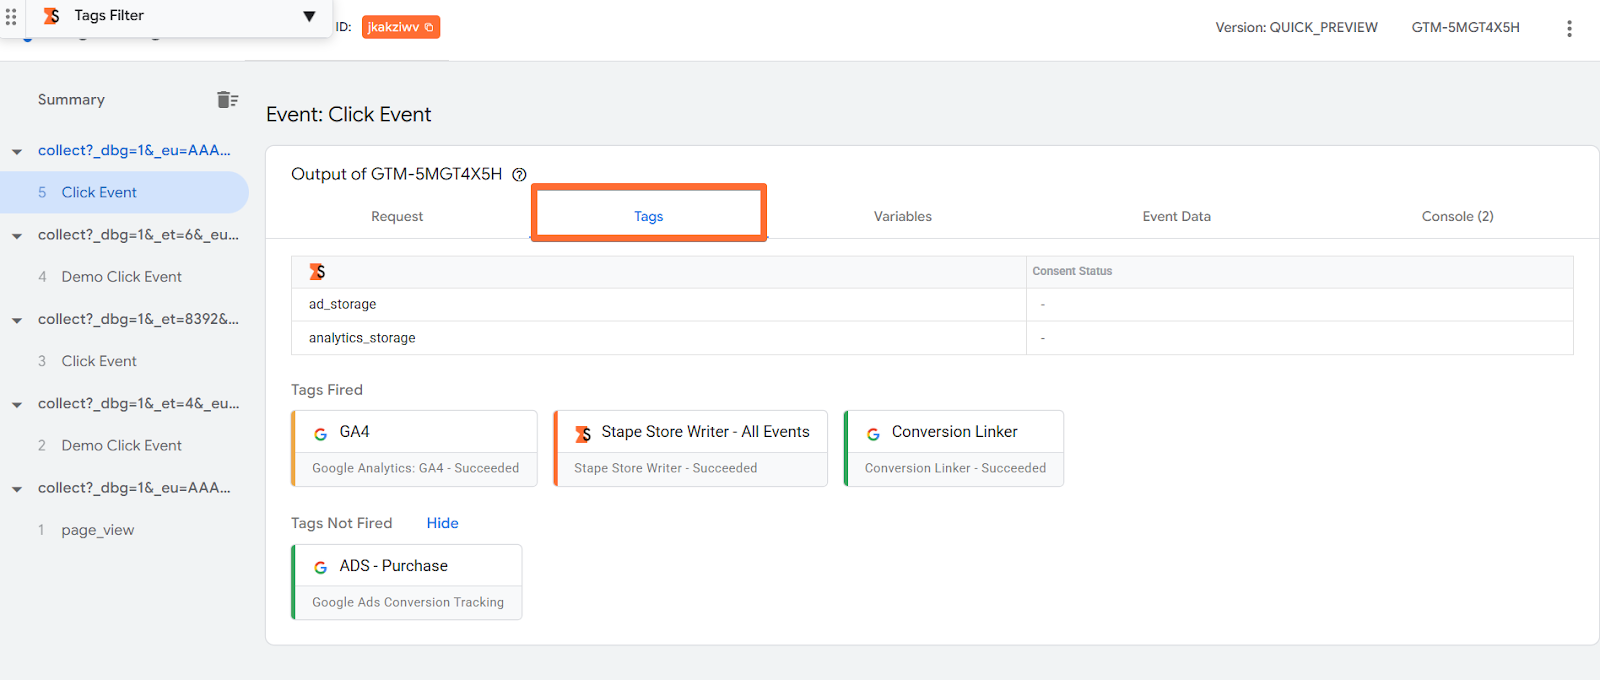
Tags tab
These are server-side tags sending data to platforms.
Common problems:
- Tag not fired.
Possible solutions:
- Trigger conditions are wrong - check the tag’s configurations.
- Variables are missing (for some platforms) - click on the tag and check the section Firing Triggers to learn which. Then check its variables to find the variables and their values to set up the tag’s trigger correctly.
Variables tab
This tab also works the same way as in web GTM preview - it shows what values your variables captured. Pro tip: while the following advice for this tab is correct, it’s best to inspect the variable values of specific tags (in the Tags tab), instead of all variables shown here. The Variables tab shows all of the variables of the container, not all of which will be relevant for each tag.
Common problems:
- Undefined or wrong values. Keep in mind, this doesn’t always mean there is an issue. For example, an email value will surely be undefined for the steps where the user hasn’t provided it yet, for instance, at the page_view event. So consider what type of event you’re inspecting while deciding whether the lack of value in its variables is an error or not.
Possible solutions:
- Check the variable’s setup in the server GTM.
Event Data tab
This screen shows you the structured data that was created by the Client that processed the incoming request. This for the server container is the same as the Data Layer tab for the web container.
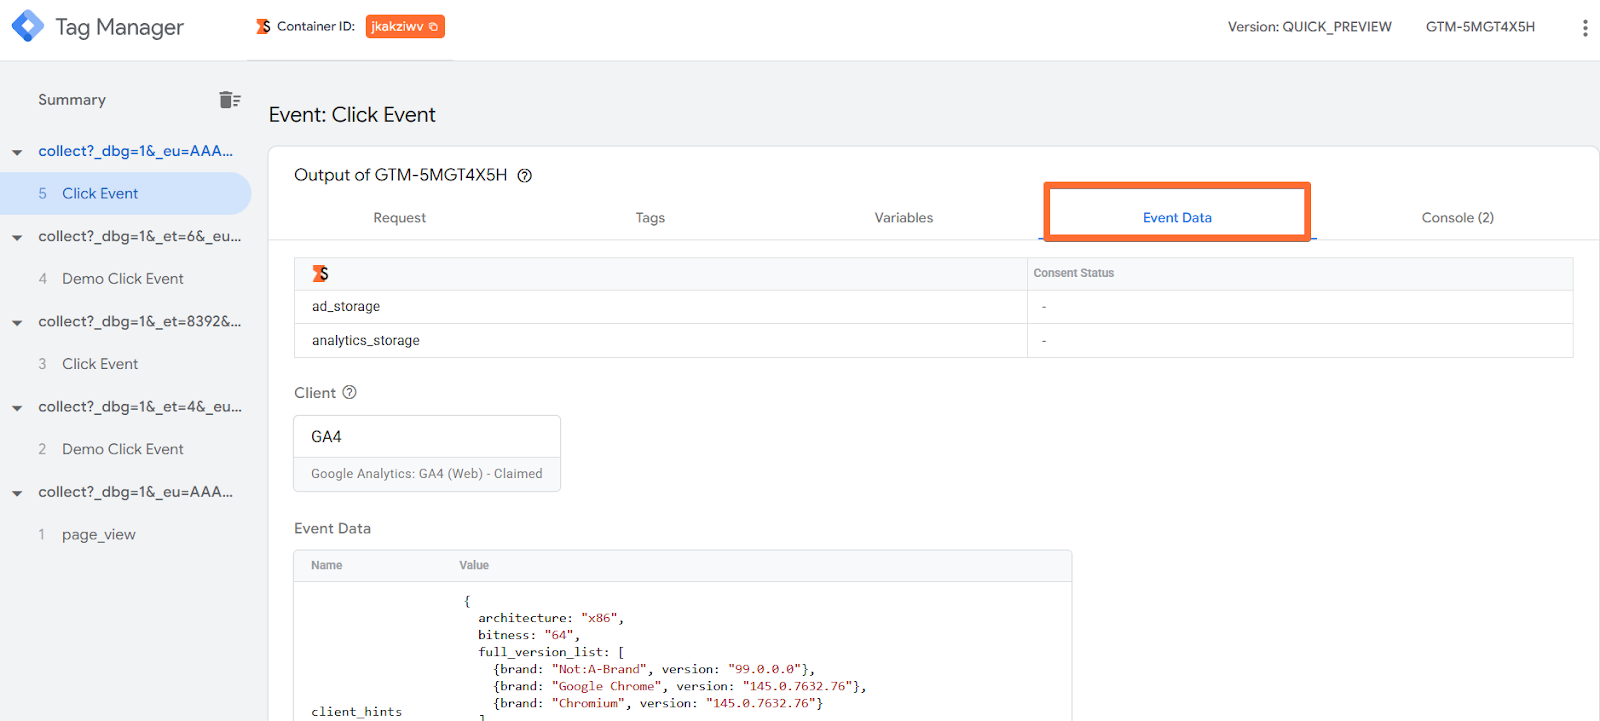
Common problems:
- Empty or incorrect event data.
Possible solutions:
- You may be sending data to the wrong endpoint. For example, you configured your web GTM's Facebook tag to send data to the GA4 path instead of Meta. The GA4 Client will claim the request because the path matches, but it won't understand the Facebook request format, so it produces no event data.
- If the data exists, but the values are wrong (e.g., price is 0, or product_name is "undefined"), first of all, check your variables in web GTM - the tag in the web container may be pulling from the wrong Data Layer variable, or the variable is misconfigured. Next, check if there are any data formatting issues (the Client failing to interpret the value). For instance, you might be sending a price as a string like "$25.99" instead of a number like 25.99.
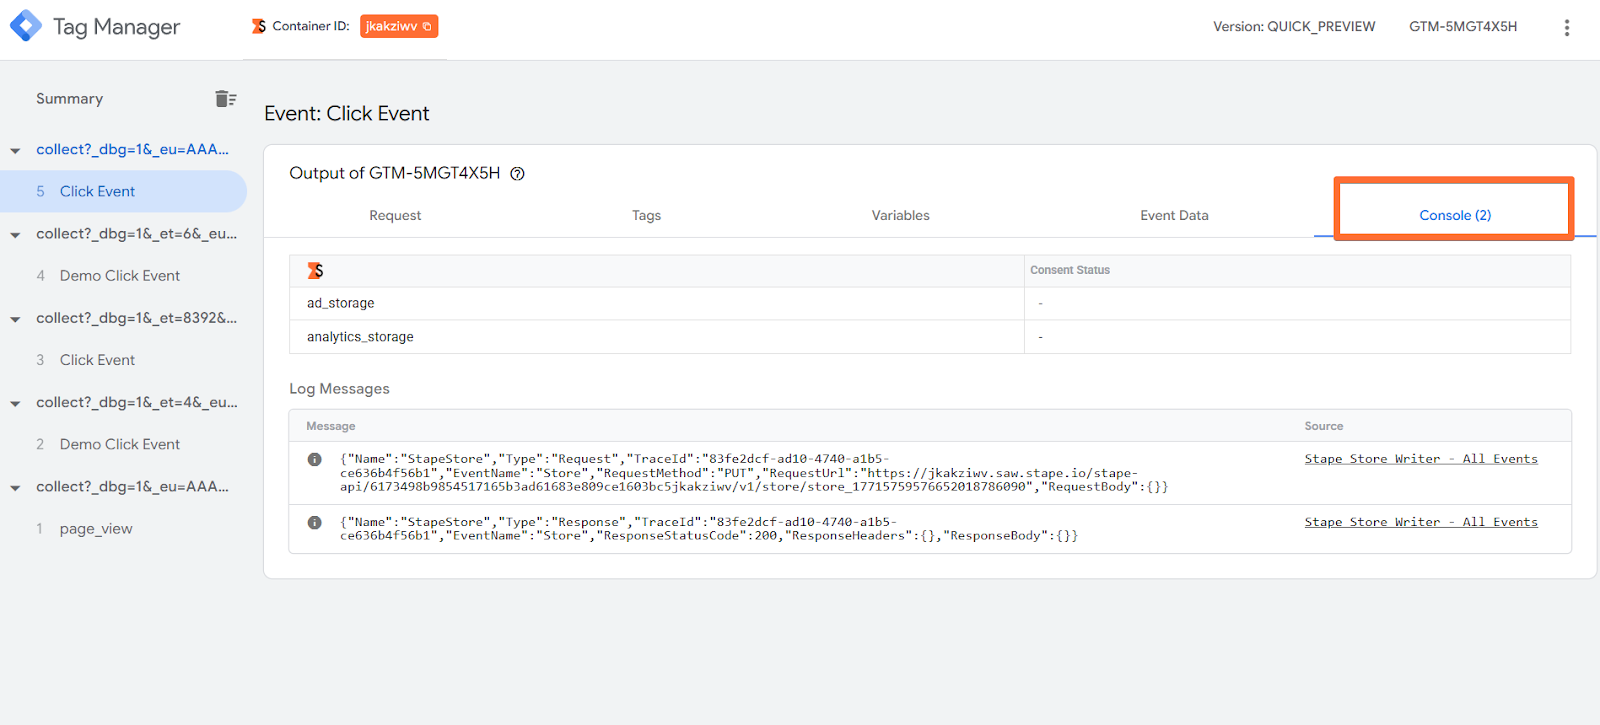
Console tab
This screen will show you information about any errors that occurred on the side of the server GTM.
Was this article helpful?
Comments