How to create monitoring alerts
Updated Jul 14, 2026
How to create an alert
1. Log in to your Stape account and select your sGTM container from the dashboard.
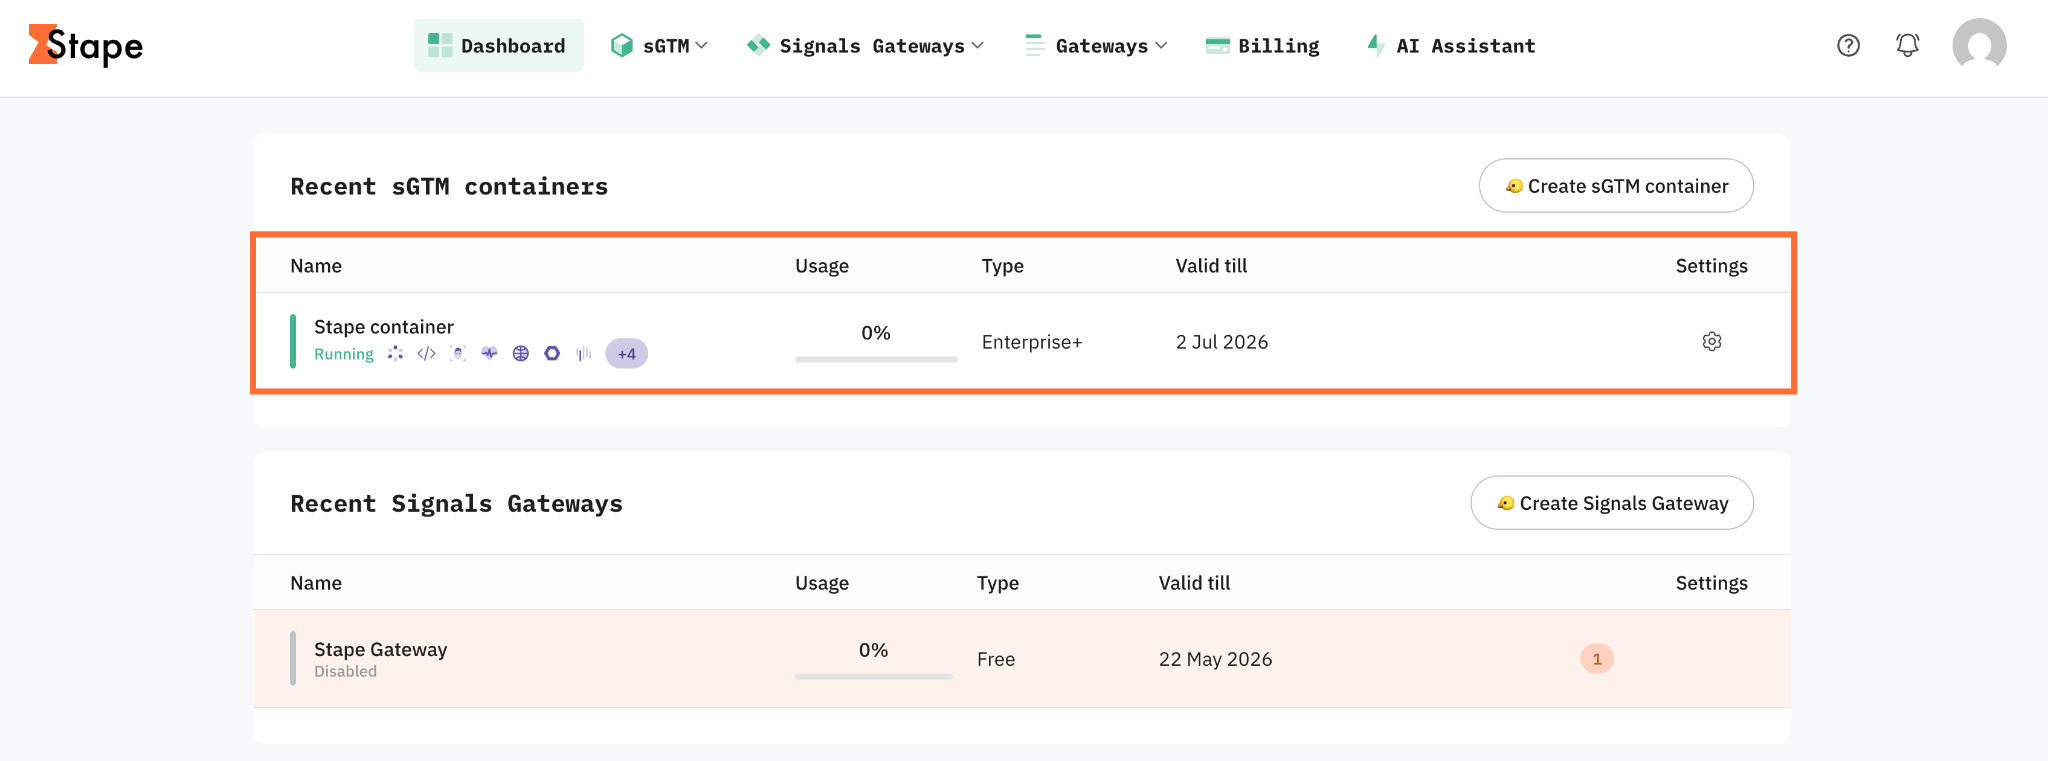
2. Click on the Monitoring tab. You’ll be asked to enable the outgoing logs, click Activate.
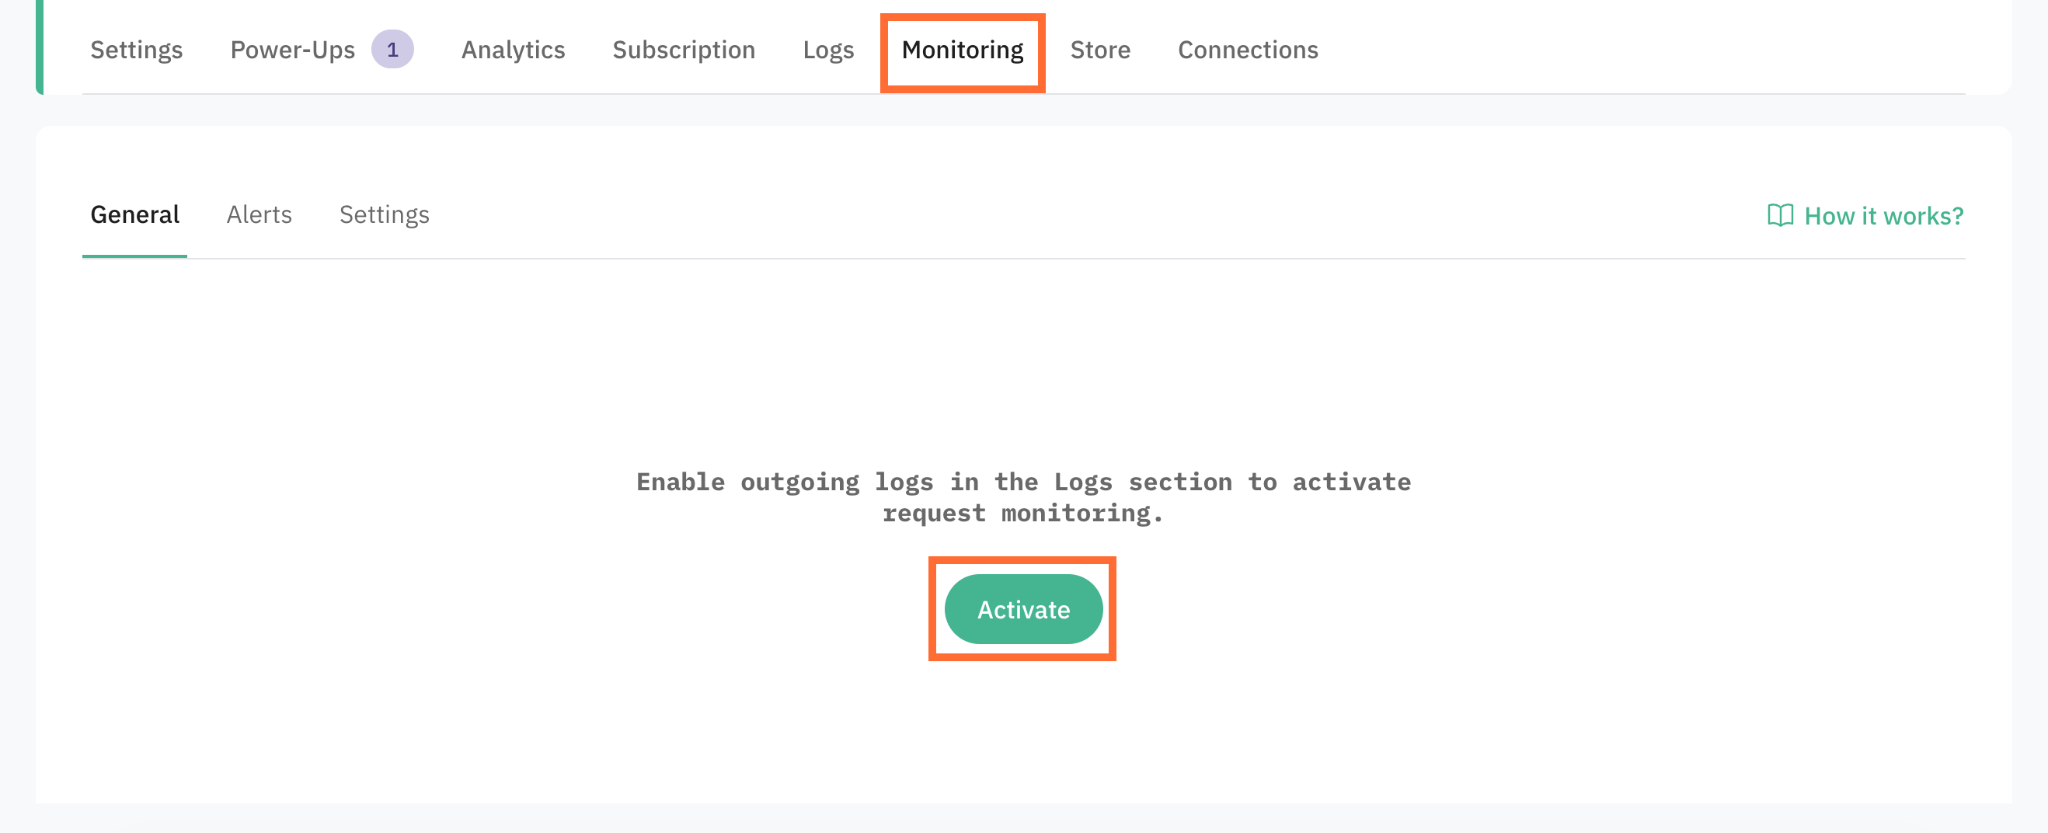
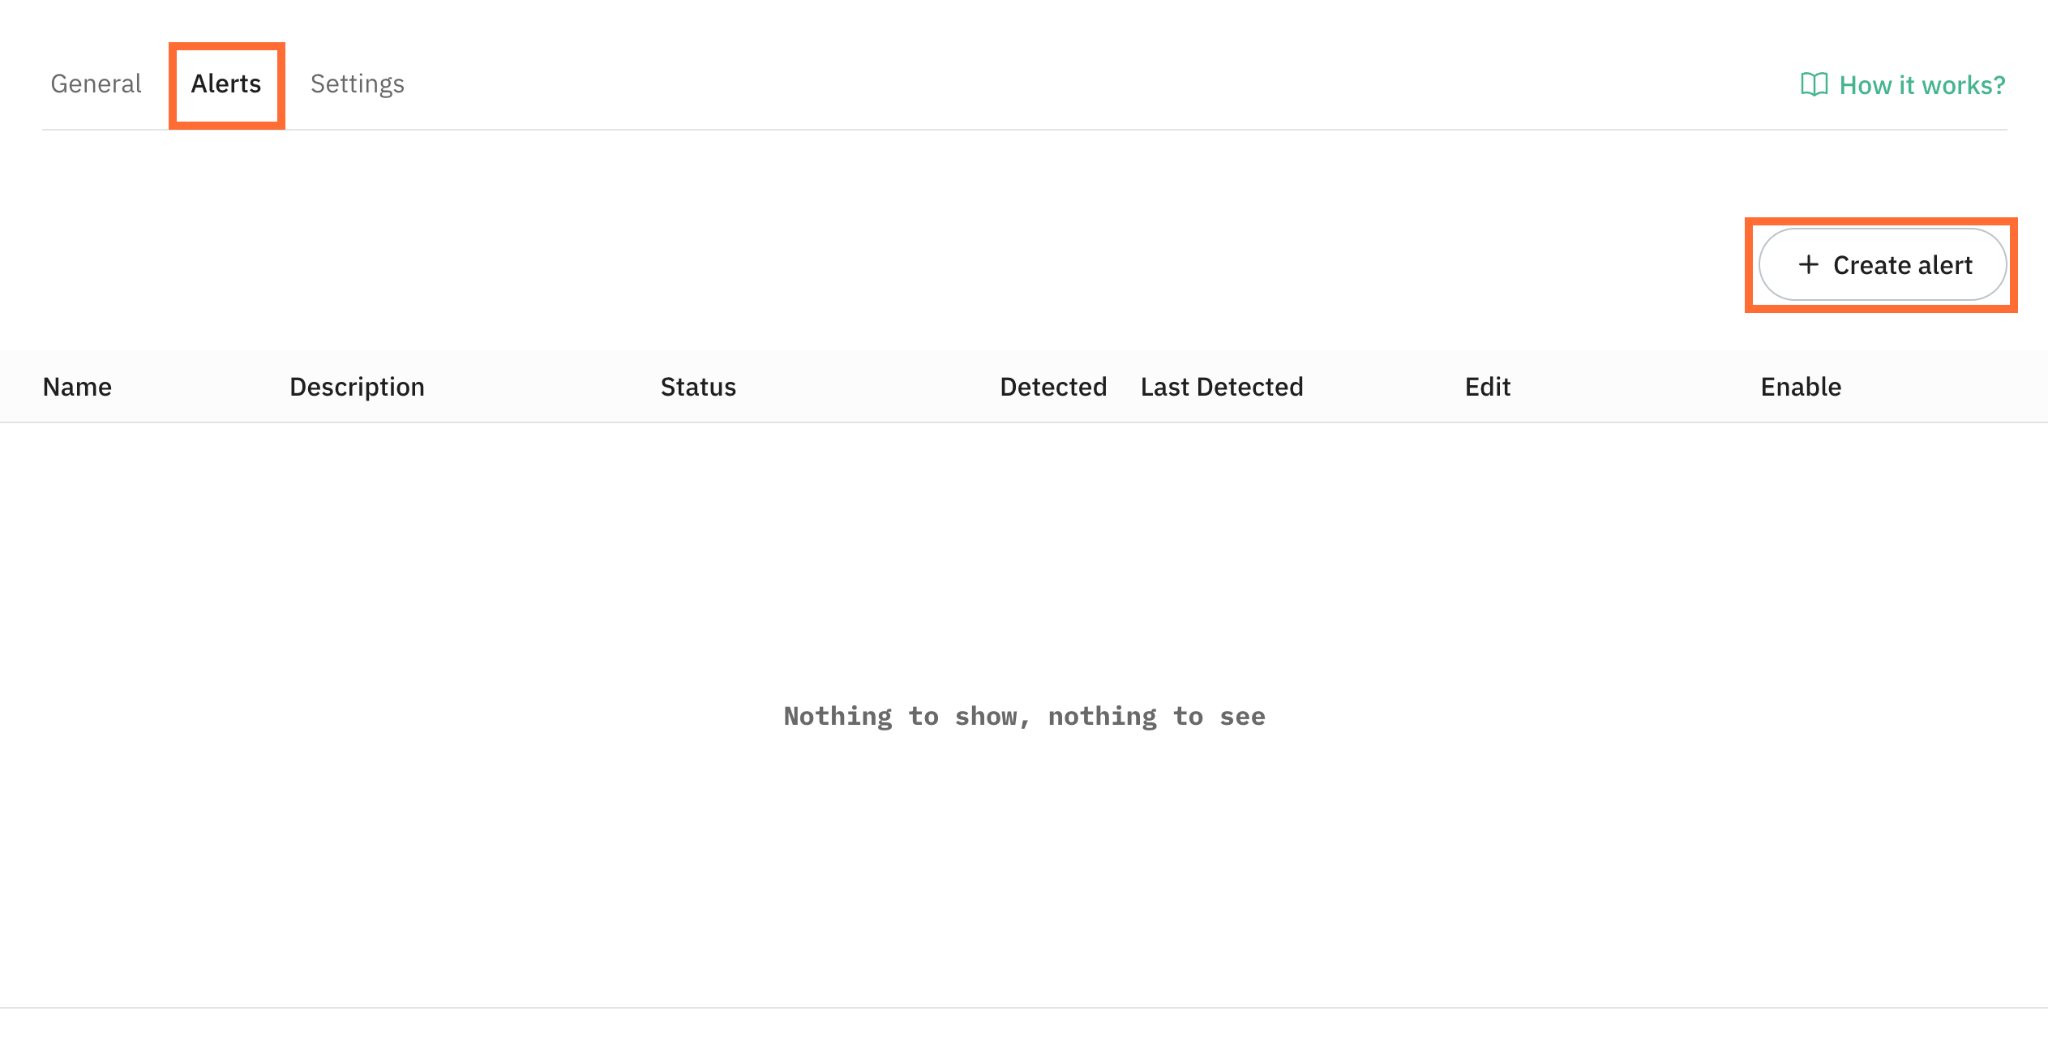
3. Click on the Alerts tab.
4. Click Create alert.
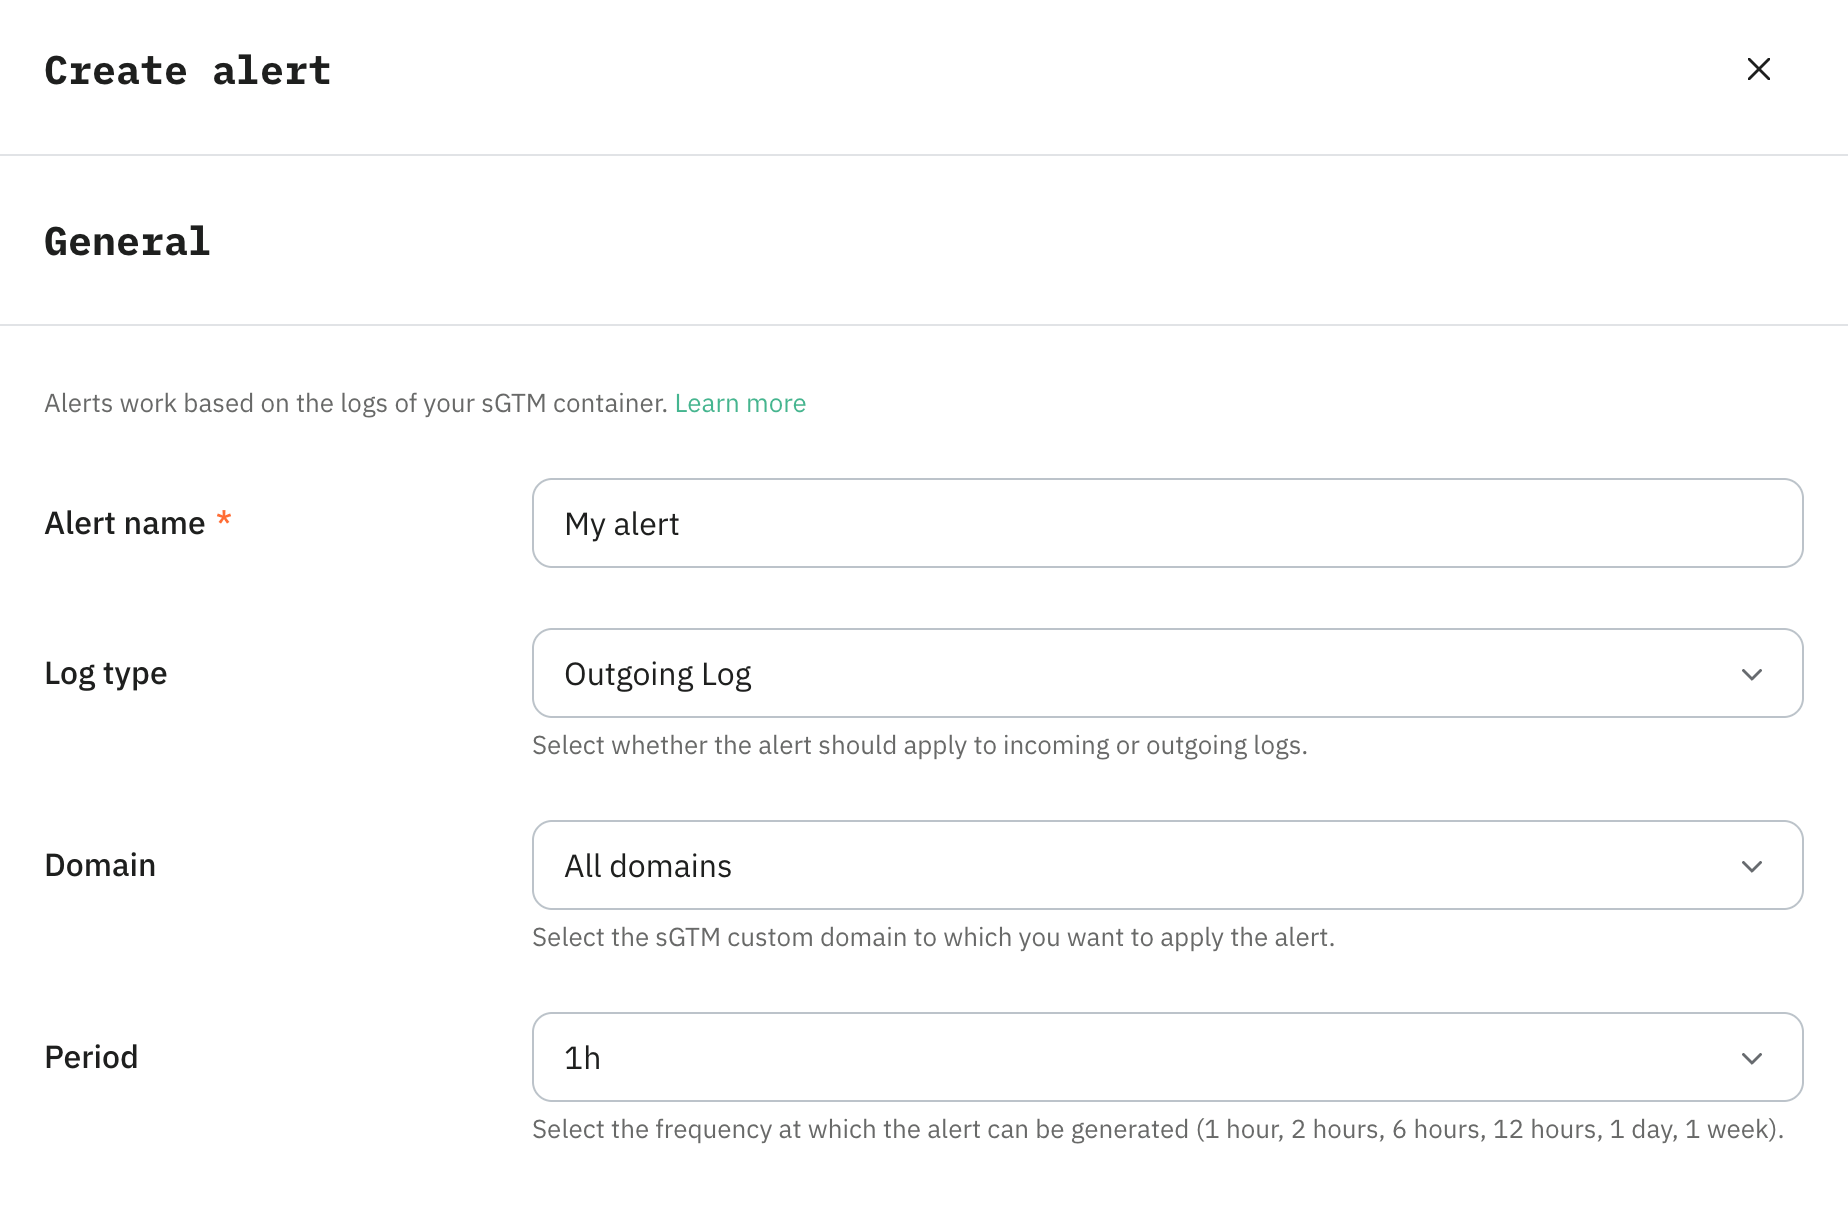
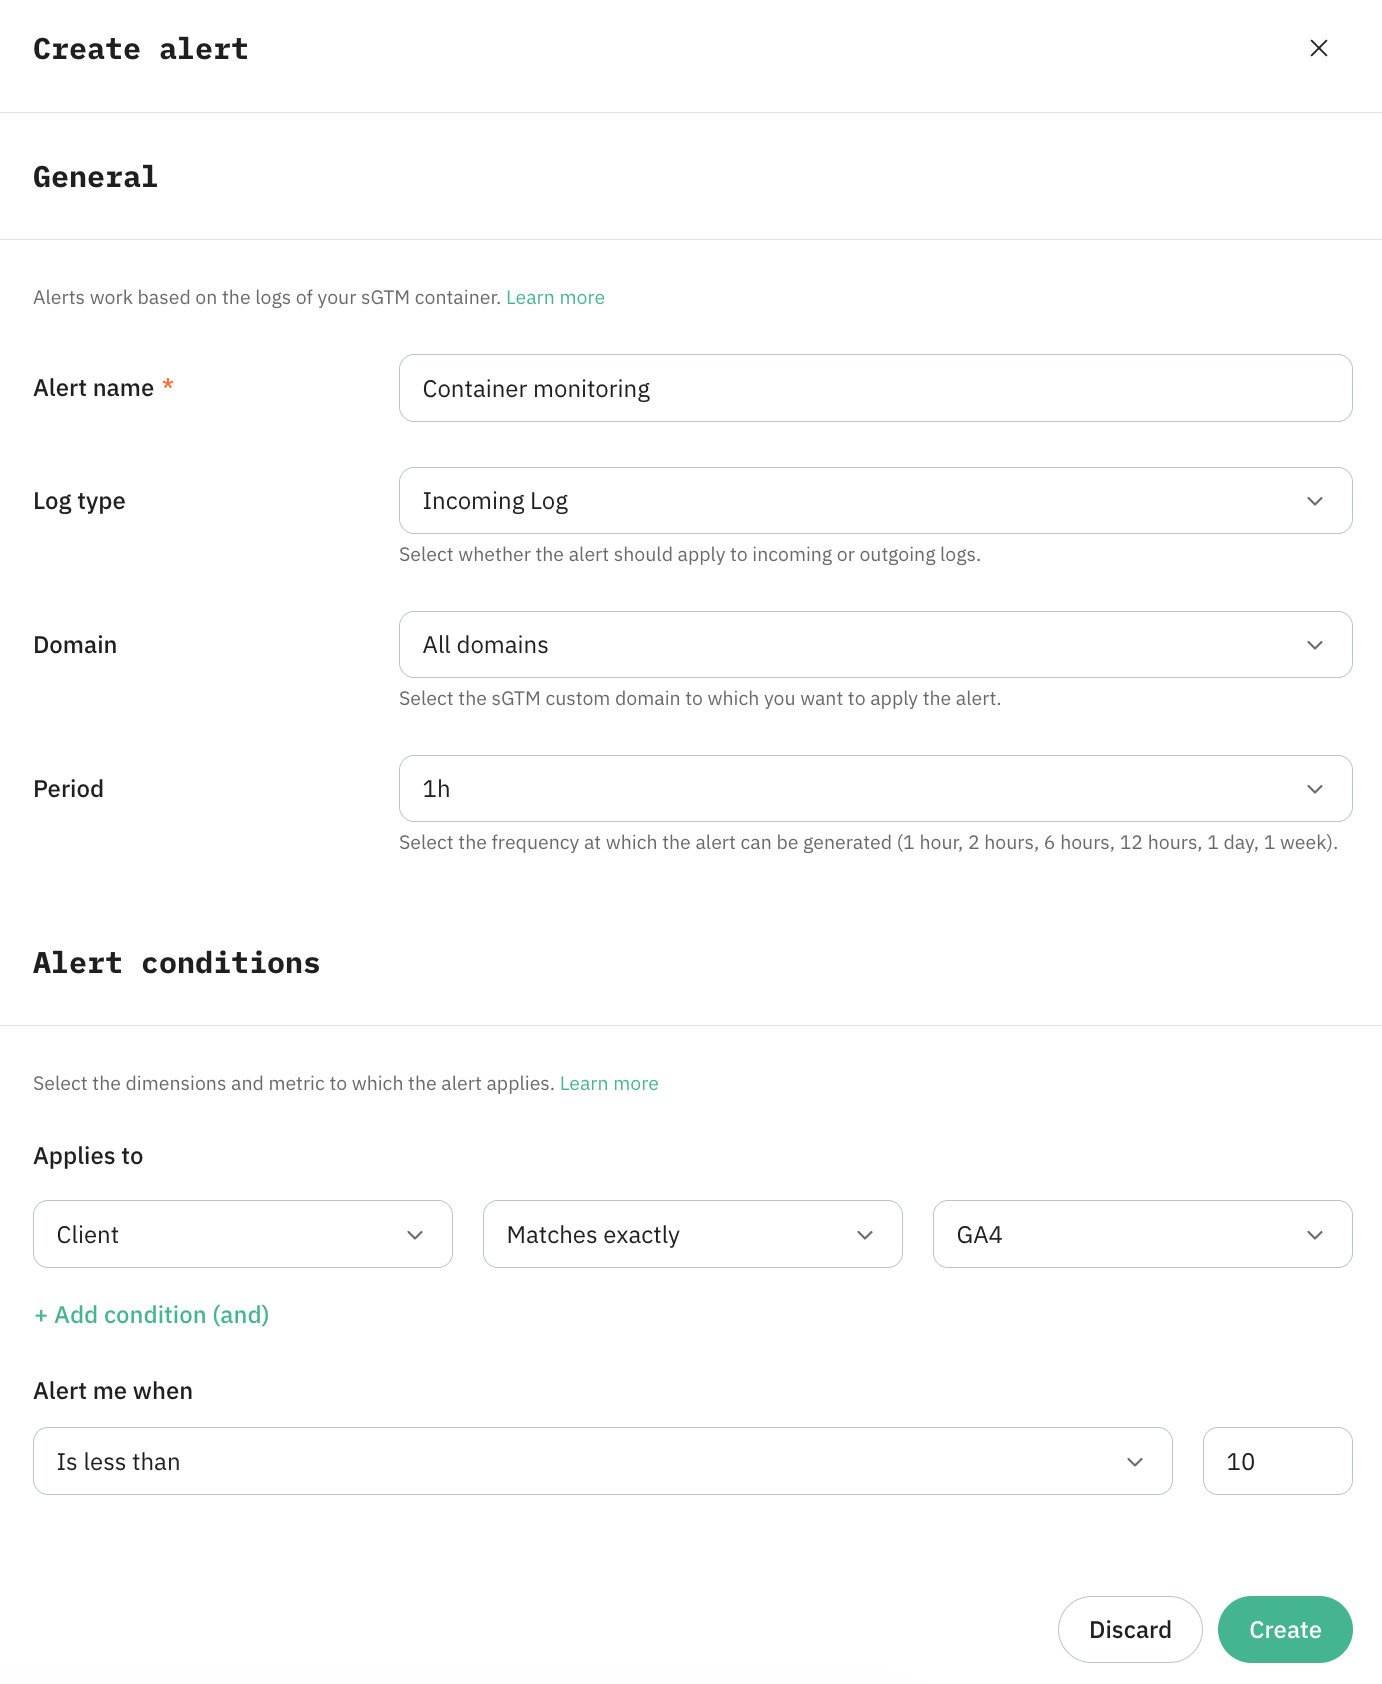
In the Create alert window, select or enter the following information:
General:
- Alert name – enter a descriptive alert name.
- Log type – select whether the alert should apply to incoming or outgoing logs.
- Domain – select the sGTM custom domain to which you want to apply alert.
- Period – select the frequency at which the alert should be generated.
Alert conditions:
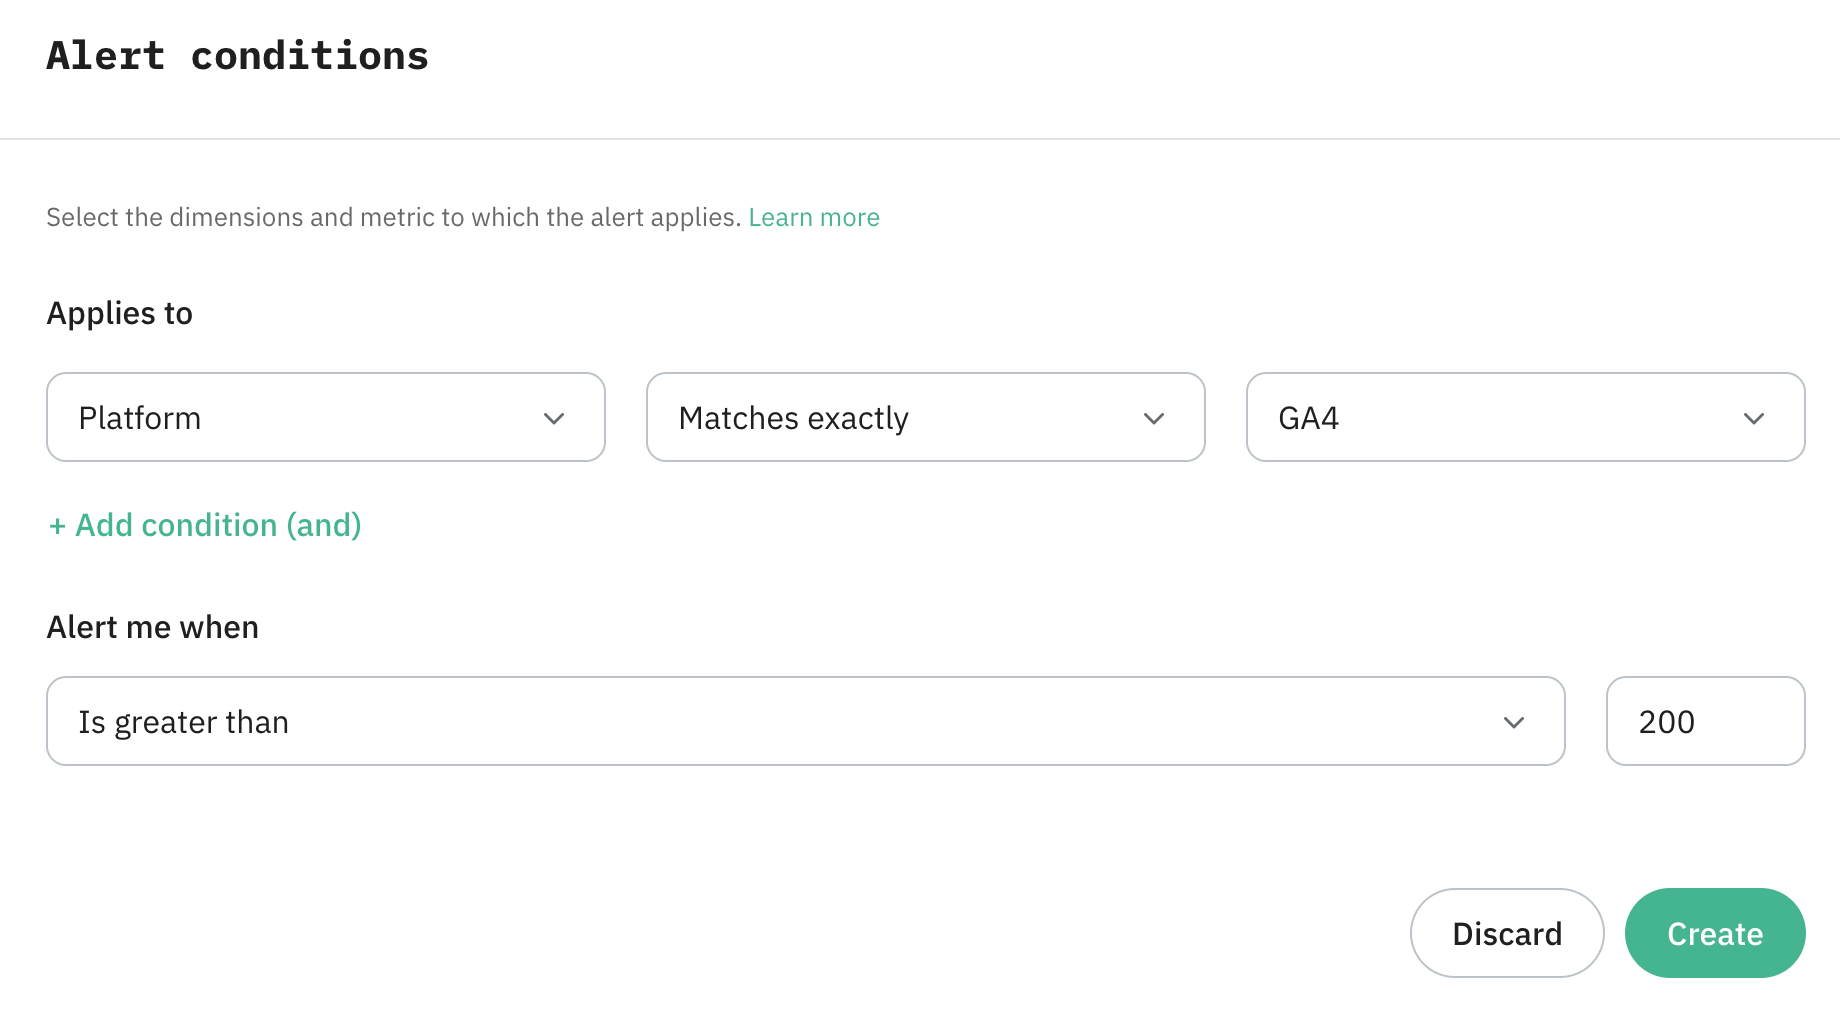
- Applies to – choose whether the alert should target a specific Platform, Event, or Status code and define the conditions that trigger the alert. You can add more conditions by clicking +Add condition (and).
- Alert me when – set the trigger threshold. Specify the number of requests and choose whether the alert should fire when the actual count is higher or lower than that value.
Click Create to create an alert.
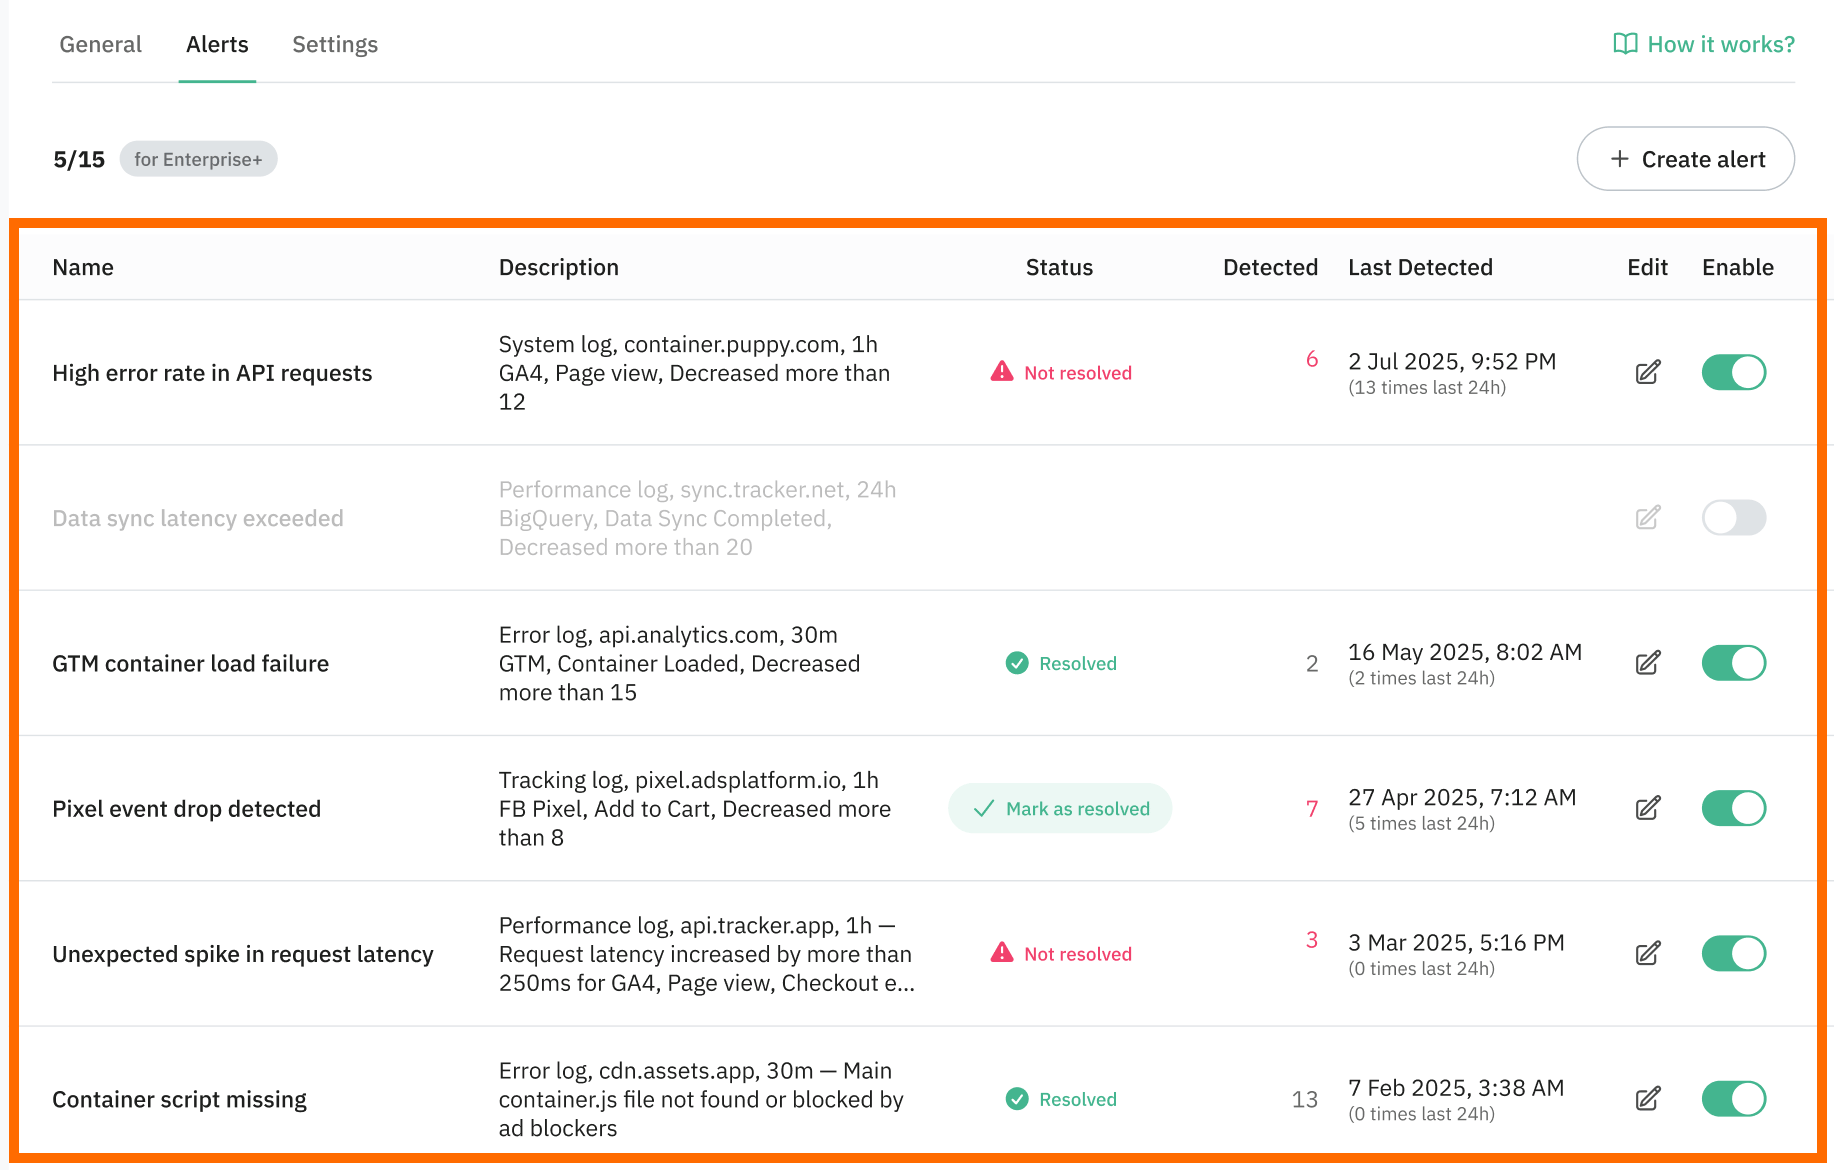
Your alerts appear on the dashboard in a table with the following columns:
- Name – the name you assigned to the alert.
- Description – a summary of the conditions that trigger this alert.
- Status – the current health state of the alert:
- Resolved – metrics are within normal limits, or you have manually marked the incident as resolved.
- Mark as resolved – an action available when an alert is Not Resolved, allowing you to acknowledge the issue and clear the alert status.
- Not resolved – the alert’s threshold conditions have been met, and the incident is active.
- Detected – the total number of times this alert has been triggered.
- Last detected – the timestamp of the most recent alert trigger.
- Edit – allows you to modify the alert settings.
- Enable – a toggle to activate or deactivate the alert.
Testing
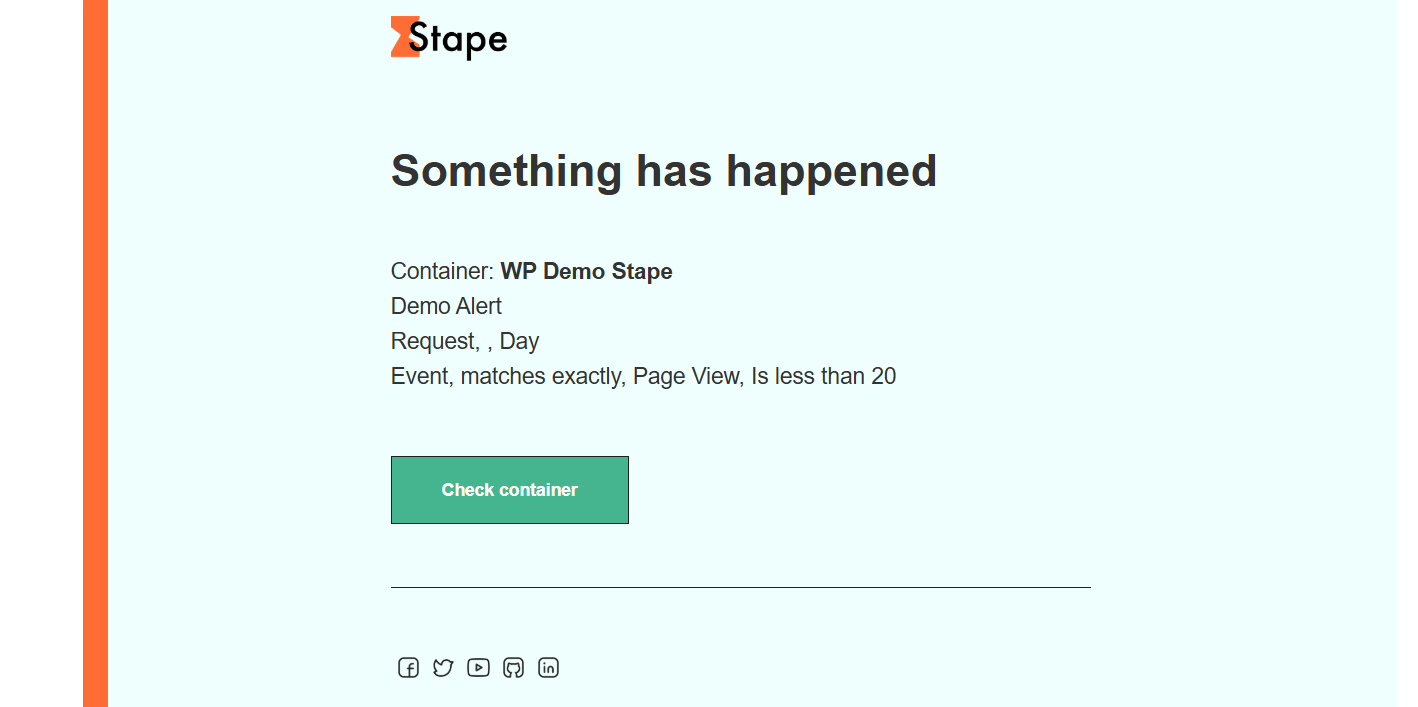
To verify that the Monitoring feature is working correctly, set up a test alert and confirm you receive notifications when it triggers. For example, create a condition that is guaranteed to be met and assign a short alert period; once that time has passed, verify that you received the notification.
Alert configuration examples
Facebook purchase events
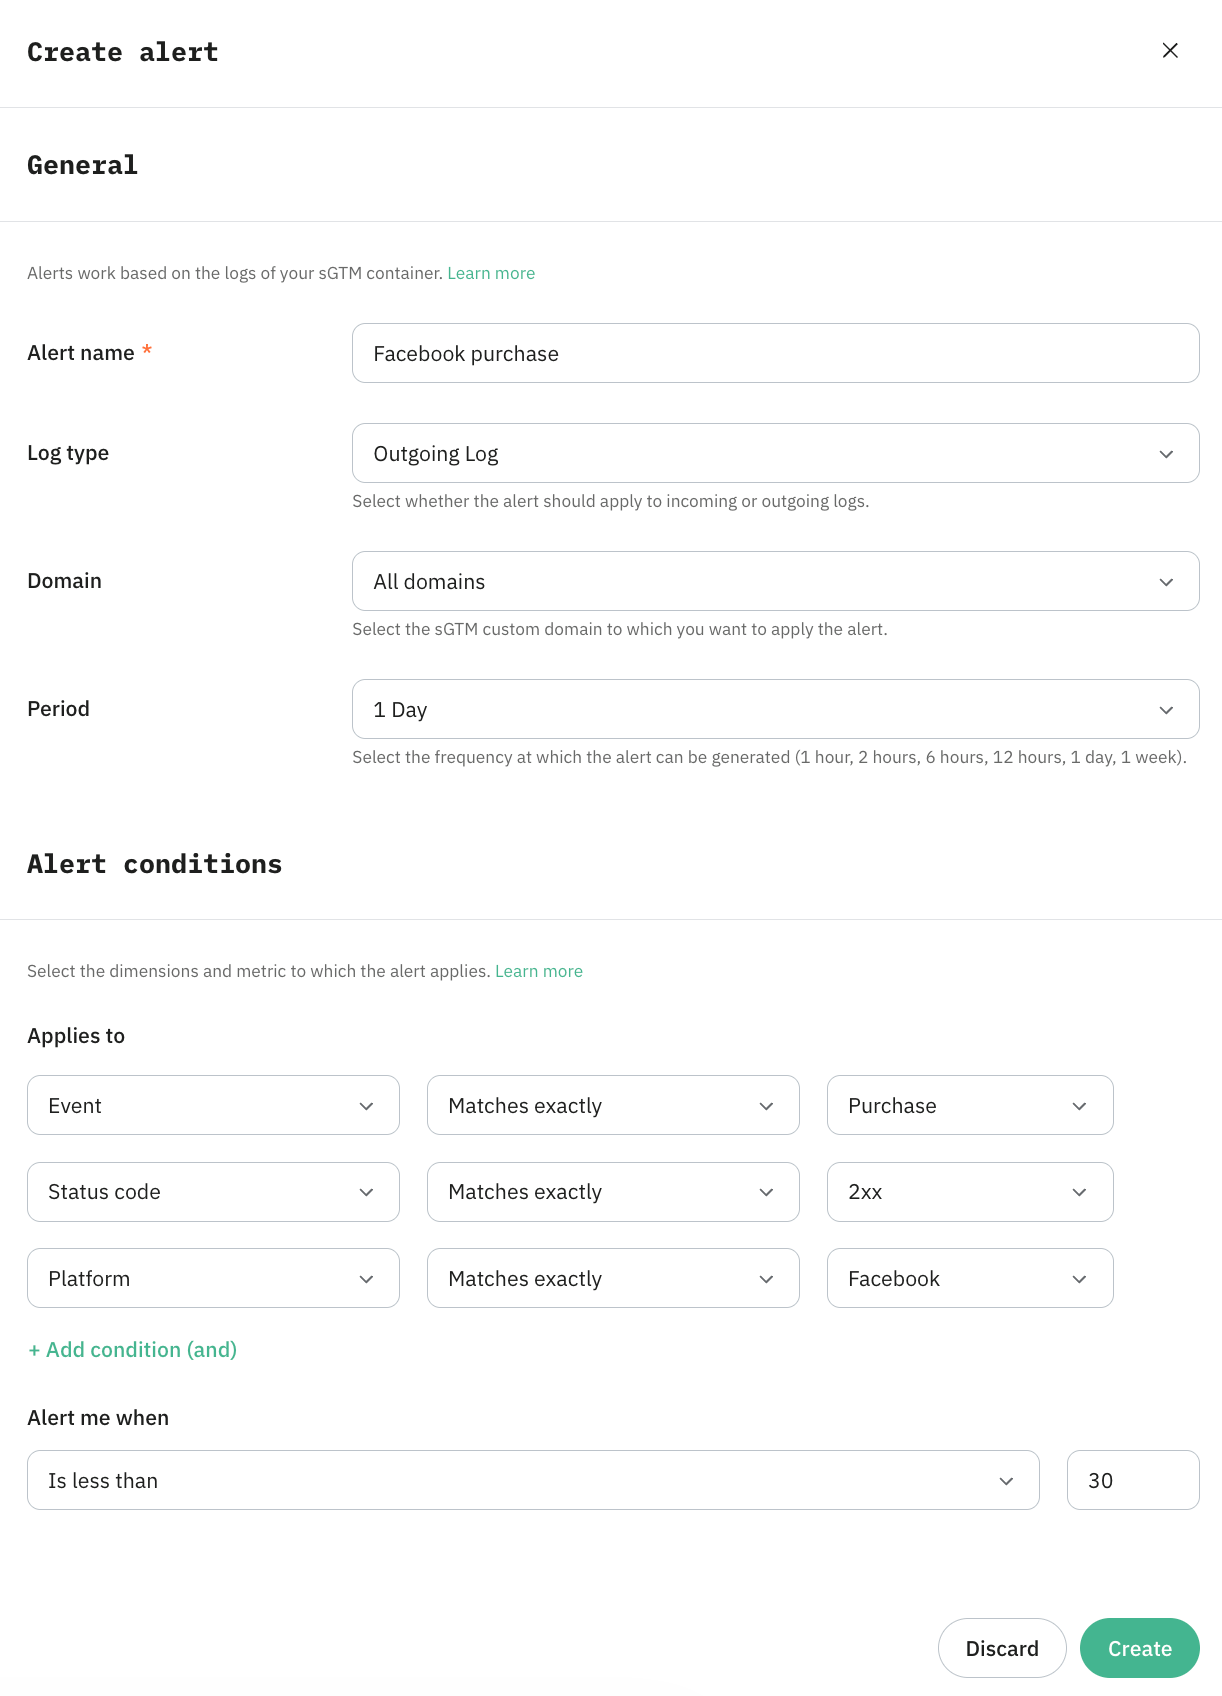
If you typically track 50 Facebook purchase events daily, you might want to be notified if the count drops below 30, as this could indicate an issue.
For this setup to work, make sure you have a configured Facebook CAPI tag.
General container operation
Checking your data once a day would mean that you will only know about problems with the containers after 24 hours have passed. To bypass this problem, you can make an additional small notification. For example, one that’s triggered by a small number of incoming logs for a GA4 client.
Was this article helpful?
🍽 Table of content:
Comments